The SAM module in AVIX
Users familiar with other time analysis modules (AviX Method etc) in AviX will see that the outline when using SAM is identical.
When AviX is running you switch to Method perspective (module) by pressing
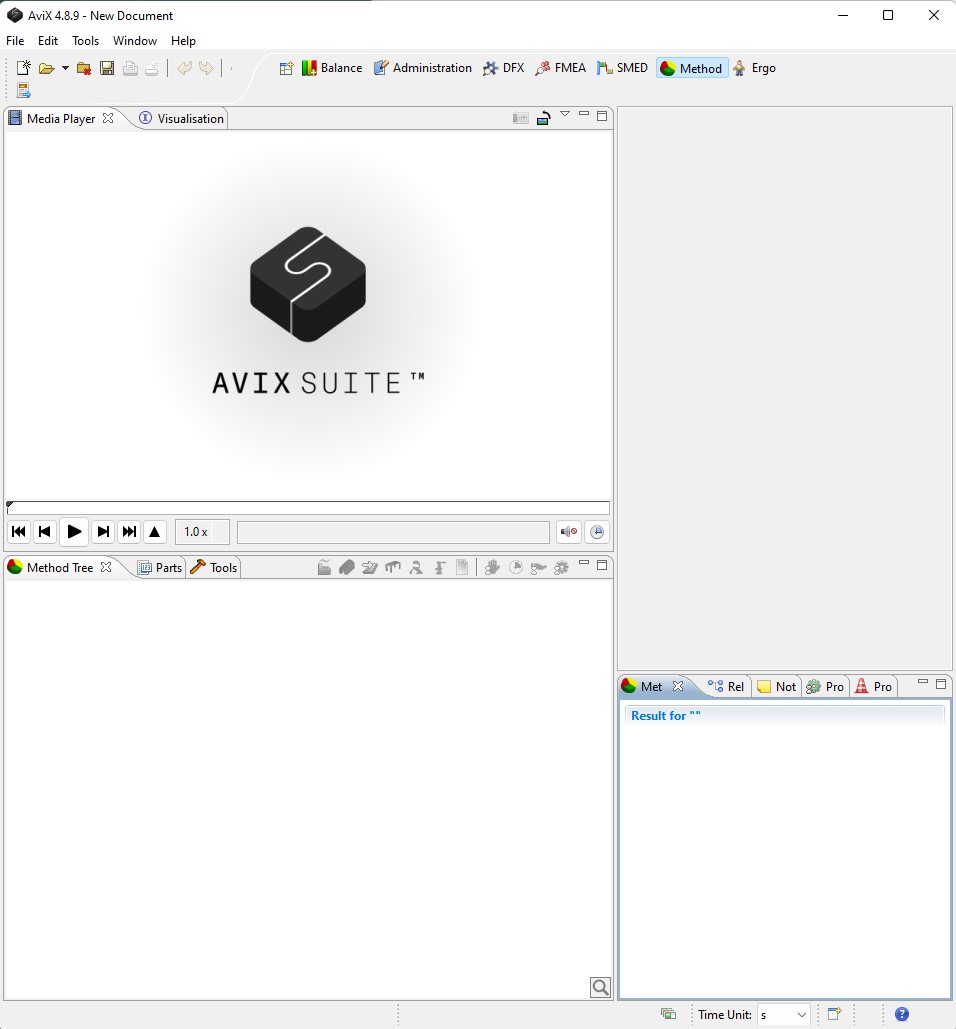
The default appearance of AviX SAM looks like below.
The different views or windows will be explained throughout this guide, but let’s start with a quick overview of the view outline:
The Method Tree view in the lower left corner is where your plant structure with the assembly process tasks is presented. In addition to base structural components such as Factory, Line and others, all available time analysis methods (AviX Method, MTM-SAM) can be created and organised in this view.
The Method result section shows the analysed time result of the objects selected in the Method Tree.
Relations display related information for the objects that are selected in the Method Tree view. This is where attached Documents and written Notes are presented.
Media Player is where the related video is being visualized. In addition to process tasks, video capabilities are also possible for any type of time measurement method, such as for instance MTM-SAM.
Detailed explanations of all generic views and features can be found in the user manual.
Performing a MTM-SAM time analysis
The MTM-SAM analysis editor is opened by clicking on an existing MTM-SAM analysis in the Method Tree, or alternatively by creating a new MTM-SAM analysis, using the designated MTM-SAM Analysis button  in that same view.
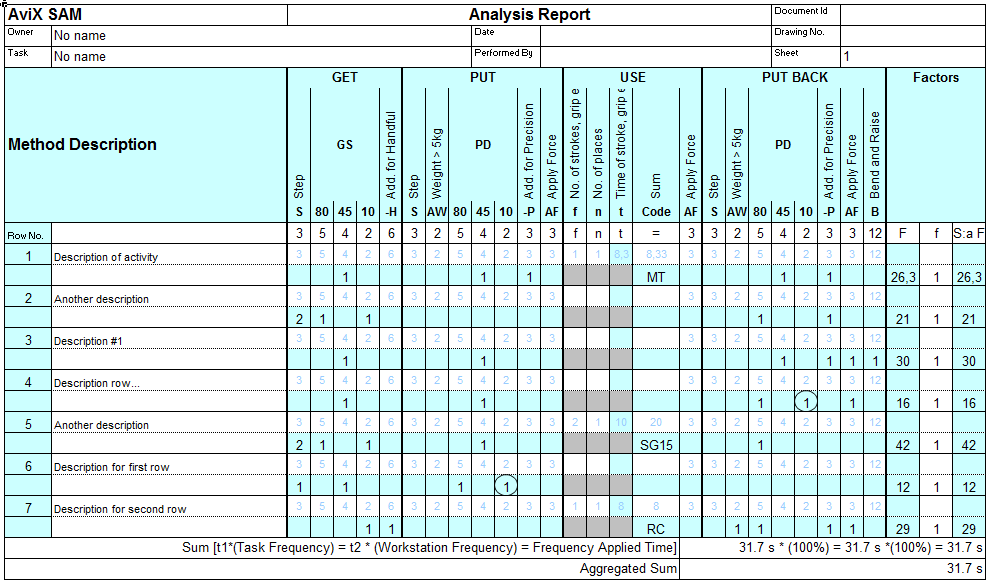
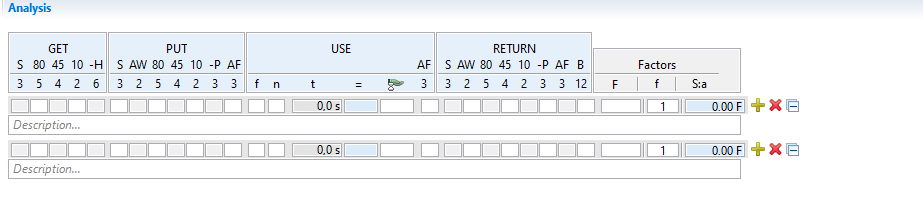
The SAM-MTM editor consists of two main parts; the part at the top which is generic for all analysis methods, which connects the analysis to movie information, objects and aids, and manages description and repetitions of the analysis. The section below focuses on the time analysis itself. It is a digitized version of the traditional MTM-SAM analysis sheet.
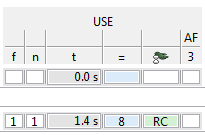
The header part of this sheet indicates four activities and one summary section. The activities are GET, PUT, USE and PUT BACK. Details concerning the use and meaning of these can be found in MTM-SAM theory documentation. Within each activity, there are sub-components denoted with names or codes, and corresponding time value in TMU below them.
Filling in Values
Analysed sequences are documented by filling in values in the white boxes. This is performed by setting focus on the box by left clicking within its borders. Filling in a value in an active box can be done by simply writing in the appropriate number, or by using the UP/DOWN arrows on the keyboard, which increase and decrease the selected value by one respectively. For quick access, it is also possible to increment the current value by double-clicking the left mouse button.
Active and Inactive Values
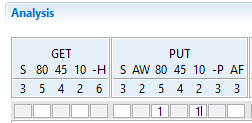
A value in the analysis can be active or inactive. Inactive, or crossed out, values do appear in the analysis but with a distinct gray mark-up, as seen in the picture, and they do not count in the time summary of the analysis. Crossing out a value can be done either by selecting an empty box and using the DOWN keyboard arrow until the desired crossed out number appears, or by pushing the right mouse button over a box with a value, and selecting Cross out or Undo Cross out from the popup menu to change the value state between active and inactive.
Repetitive Activities
Repetitive activities can be added to the analysis by either filling in a valid activity code, or by selecting a code from the right mouse button popup menu. Besides the activity codes defined within the MTM-SAM theory, it is also possible to fill in code “MT”, Machine Time, in order to fill in a measured time manually instead of using the predefined times for each activity.
Method Result Classification for SAM
The AVIX Method result view has inherent support for classifying analysed time in different categories and color coding these for easy overview. Classification for SAM analysis objects is currently limited to considering all time as unspecified SAM analysed time and adding red color code for analysed time that originates from bends or steps.
Follow up – SAM Report
Currently, one report exists within AVIX SAM. It will give you a quick overview of the selected Workstations and Process Tasks.
This report can be printed by selecting one Workstation or a set of process Tasks in the Method Tree, and running the Print action (File ➝ Print...).
The report will contain one page per Process Task. Apart from the report header, each page contains a label with the activity information, descriptions of each analysis row, the input data set on each row, and summary time analysis information. This report is created to mirror traditional paper-based Sam analysis sheets closely.