Losses in Resource Balance
This is an explanation of the color bar seen in the Balance chart of the Resource Balance module.
If you have an
operator A, performing Task A of 100s and
operator B, performing Task B of 80s,
then they are not equally balanced.
This is called an internal loss and is shown in the colored bar to the left.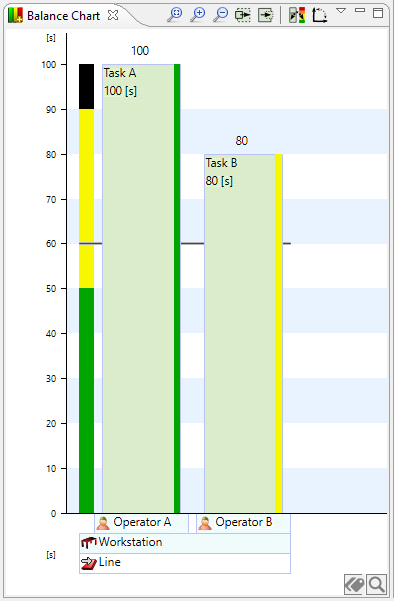
The colored bar to the left shows the distribution of Work classifications and the internal loss in percent.
Here we see that the black portion is 10%.
This is because Task A (100s) + Task B (80s) + the difference between Task A and Task B (20s) = 100%
So 20s = 10% of the total above.
So if 10% of Task A (10s in this case) is moved from Task A to Task B, they would both be 90s and there would be no internal loss.
In the toolbar you can cycle through the views to show this bar.
The tools are from left to right:
Fit, zoom time, zoom out time, wider, thinner, cycle view and toggle axis mode.