Result and Reports
Result & DFA KPI
Once the analysis is done, the result and summary can be viewed by scrolling right in the grid.
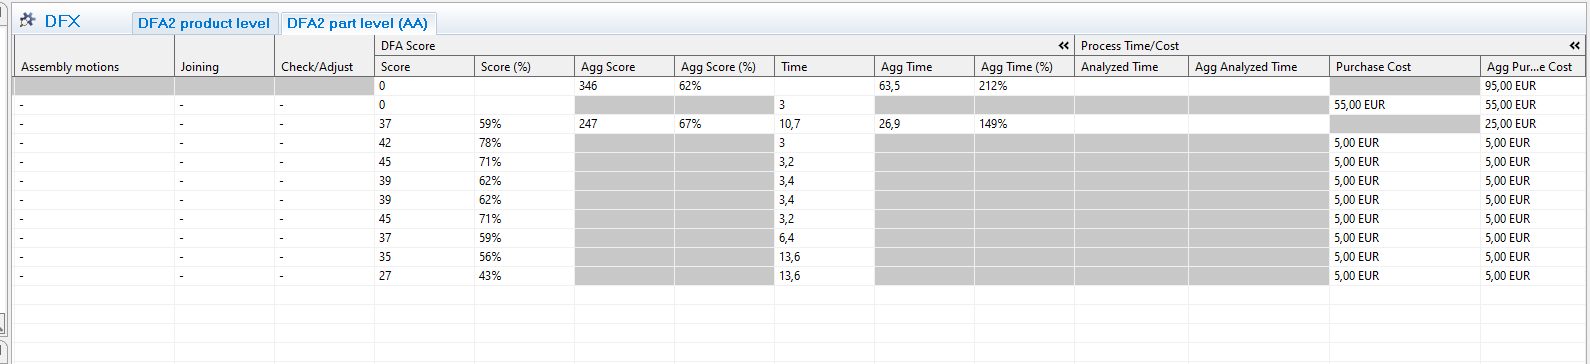
- Score: DFA score that can be compared with the same product in another state of design process
- Score (%): DFA score compared to the total number of score possible.
- Agg score: Aggregated score for all parts.
- Agg score (%): Score divided with total score. Should be at least 70% according to benchmark standards in DFAA
- Time: Optimal time is 3 seconds according to DFAA and are achieved when evaluation is green (score 9).For yellow (score 3) and red (score 1) time is added according to DFAA
- Agg. time: Aggregated time.
- Agg Time (%): How many times longer is required to perform the assembly compared to optimal DFAA index.
(E.g. 500% means 5 times longer than optimal according to DFAA standard)
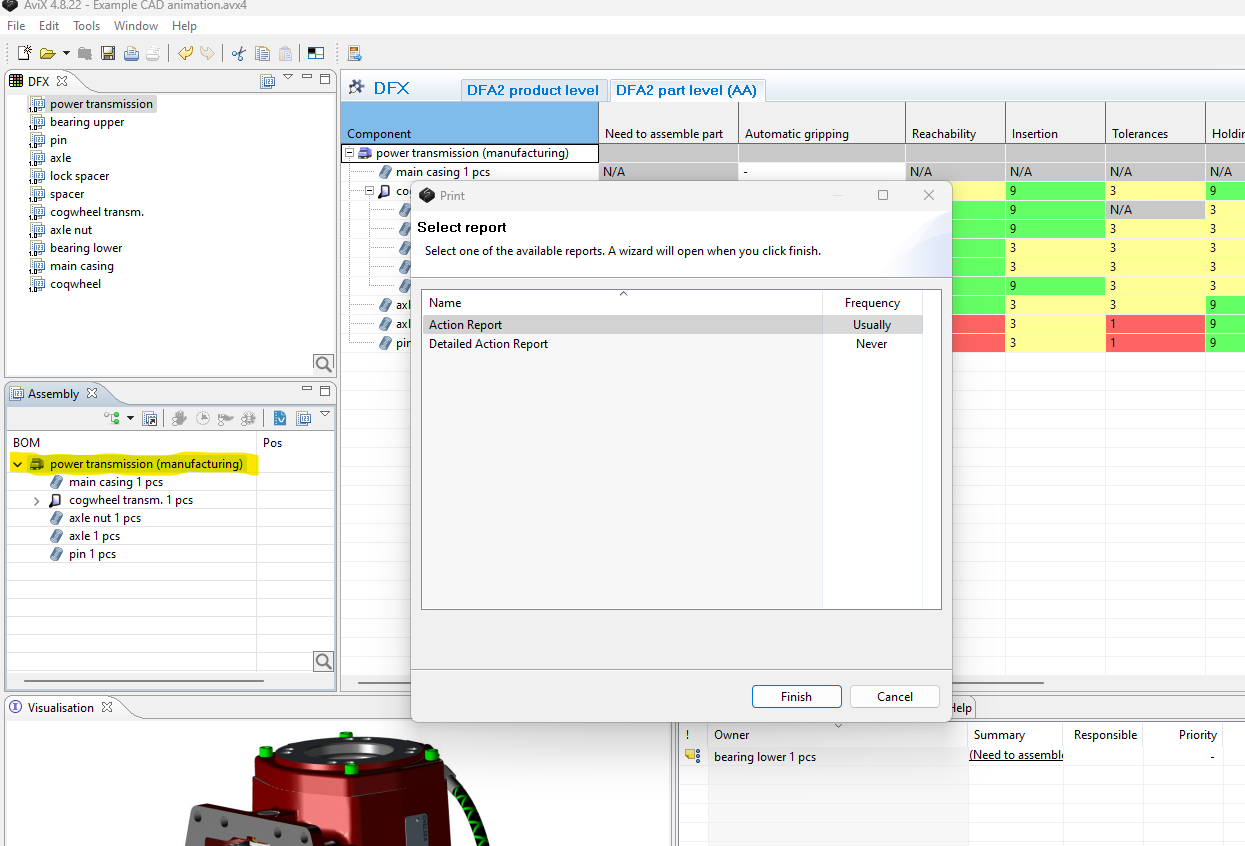
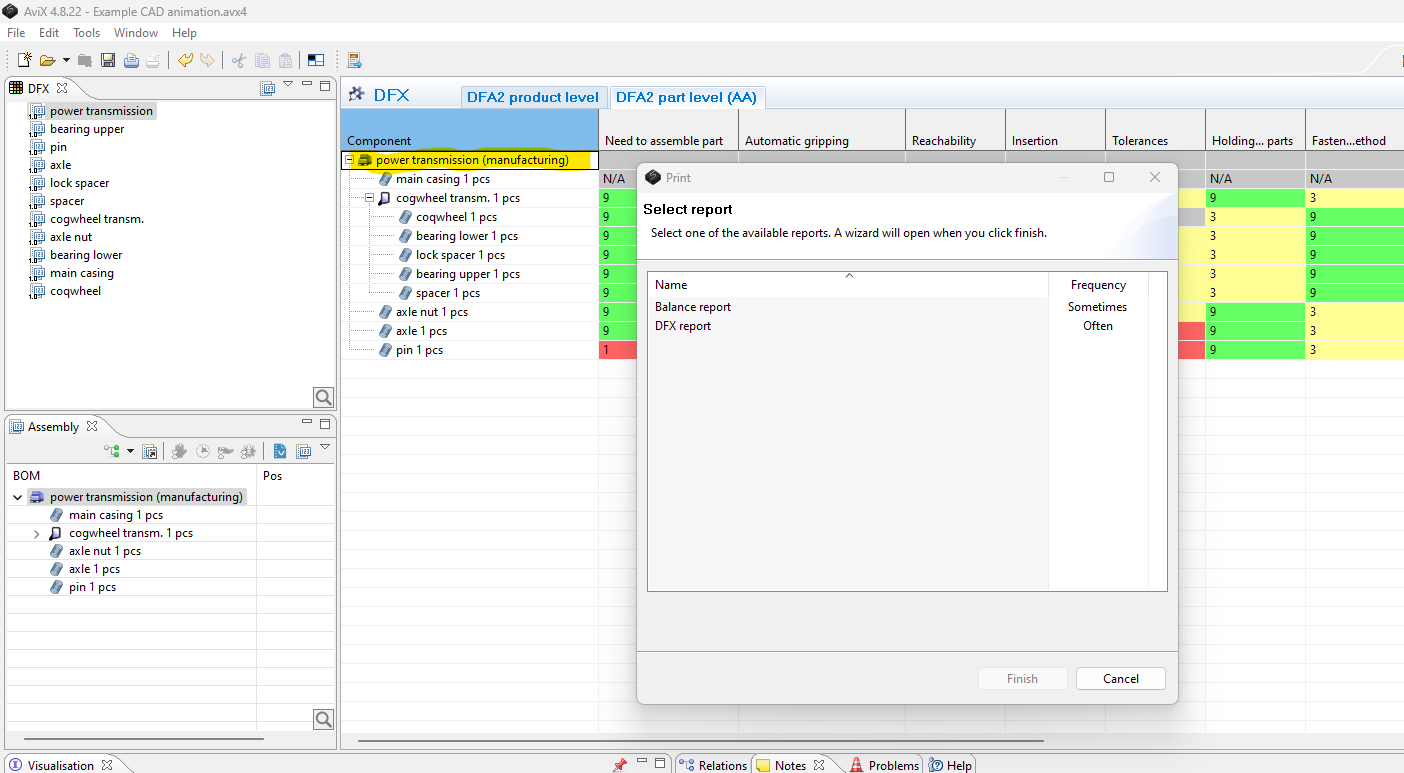
Reports
Two reports that can be printed after completing a DFX analysis:
The DFX report, is printed by: Selecting the top assembly level in the DFX grid --> Print button
The Action report, is printed by: Selecting the top assembly level in the Assembly view --> Print button