Result and Reports
Result
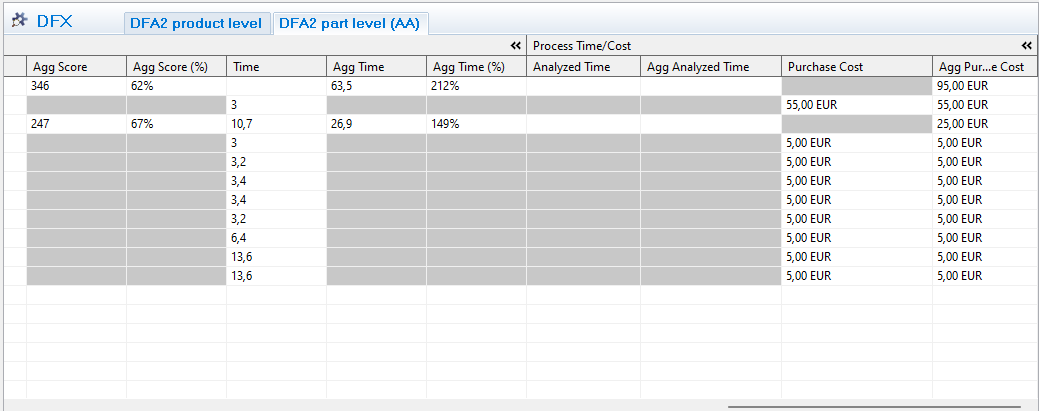
Once the analysis is done, the result and summary can be viewed by scrolling right in the grid.
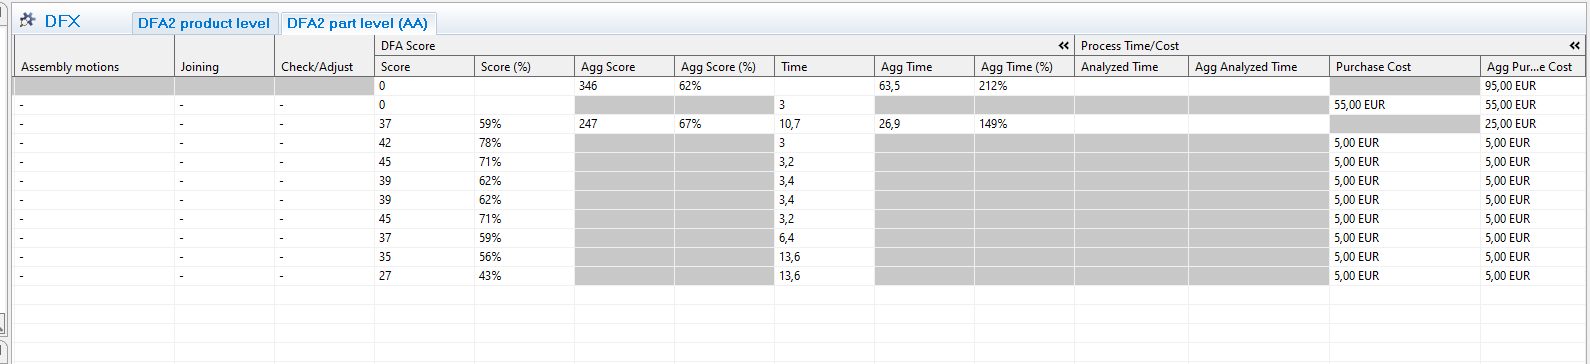
- Score: DFA score that can be compared with the same product in another state of design process
- Score %: number of points compared to the total number of points possible.
- Agg score: summary of all parts
- Agg score %: Should be at least 70% to get a good product. (score divided with total score)
- Time/agg. time: Optimal time is 3 seconds and for some red and yellow answers it gives added time
- Agg time%: How many times longer is required to perform the assembly, (Ex 500% means 5 times longer than optimal according to DFAA standard)
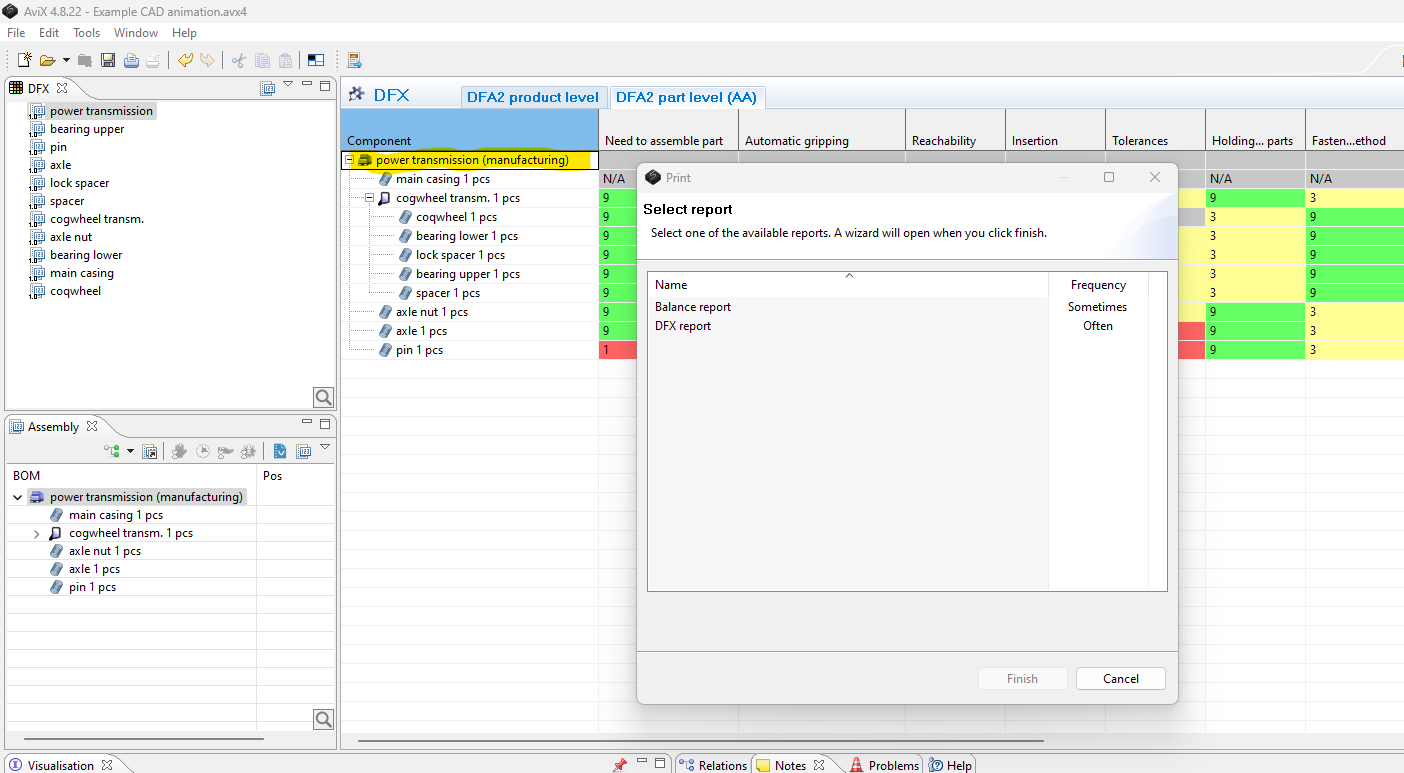
Reports
There are currently two interestingTwo reports that can be printed after completing a DFX analysis: the generic DFX report and the Notes report.
The DFX report, which is printableprinted forby: allSelecting typesthe oftop DFXassembly analyses,level is possible to print either by selecting a DFX analysis in the DFX view,grid or--> when the DFX analysis editor is open. The print action is accessible either via the printPrint button
The Notes reportAction (areport, standardis reportprinted availableby: not only forSelecting the DFXtop module)assembly islevel preferably executed by selectingin the top-levelAssembly Componentview of the BOM that has been DFX analysed. This will include all Notes for every Component below the top-level one. Once again, select--> Print butbutton
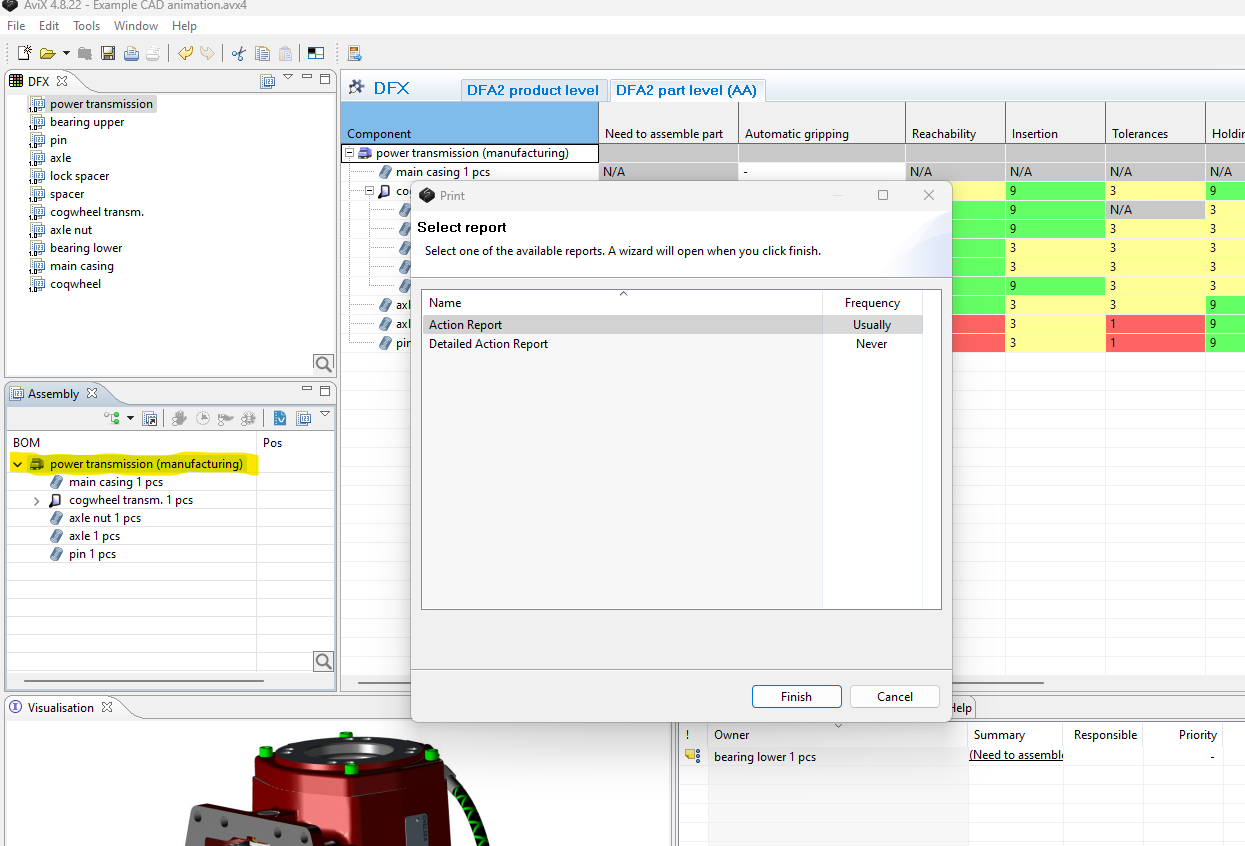
select the Notes report. For information about options concerning sorting and filtering when printing a Notes report please see Guide to Notes report under help in AVIX.
AVIX DFA KPI
DFA Score: Only to compare two designs of the same product
DFA score %: Compare between all products regardless of what, not to be below 70%
Time agg %: The theoretical time it takes to assemble a part/product in % compared to if it was optimal 3 sec.
Re-evaluating & Comparing two designs
After the initial DFX analysis of a certain BOM, different activities within the different disciplines (e.g. purchase, design) might have resulted in a proposed re-design of the product. It is thus a logical step to compare the “DFA index” for the original BOM with the new re-designed one.
Re-evaluating new design
As per methodology
COMPARING DFA SCORES
When comparing two designs it is noticeably that an improved design might have a lower DFA score than the original design. This is because eliminating a part will reduce the total score, making it difficult to compare designs using the DFA-score (Aggregated score) itself.
When comparing two designs, you can:
- Use the %-score (Agg Score %)
- Use the theoretical DFA-time
- Each DFX aspect generates a time based on a theoretical optimal assembly. Thus, comparing two designs where the new design has a lower DFA score it will also have a lower DFA time since it conatins less parts
- Each DFX aspect generates a time based on a theoretical optimal assembly. Thus, comparing two designs where the new design has a lower DFA score it will also have a lower DFA time since it conatins less parts
- Compare the total number of parts.
- Less parts will be a simpler (better) design
- Less parts will be a simpler (better) design