Result and Reports
Result
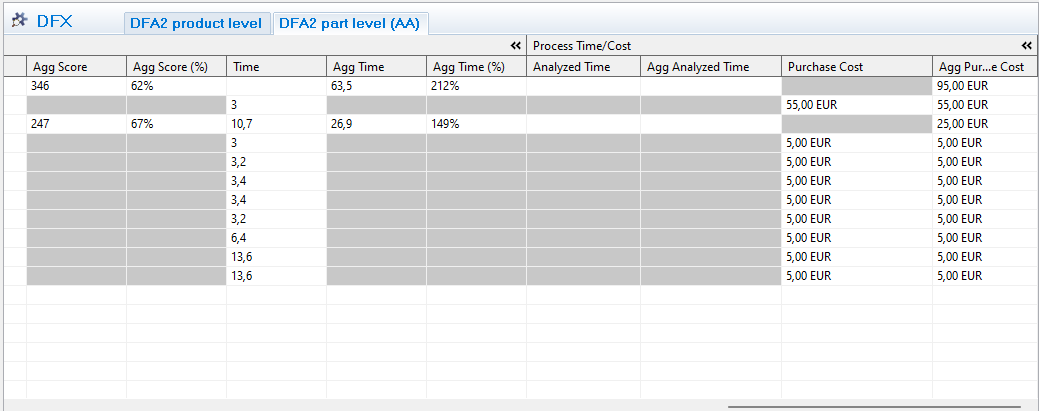
Once the analysis is done, the result and summary can be viewed by scrolling right in the grid.
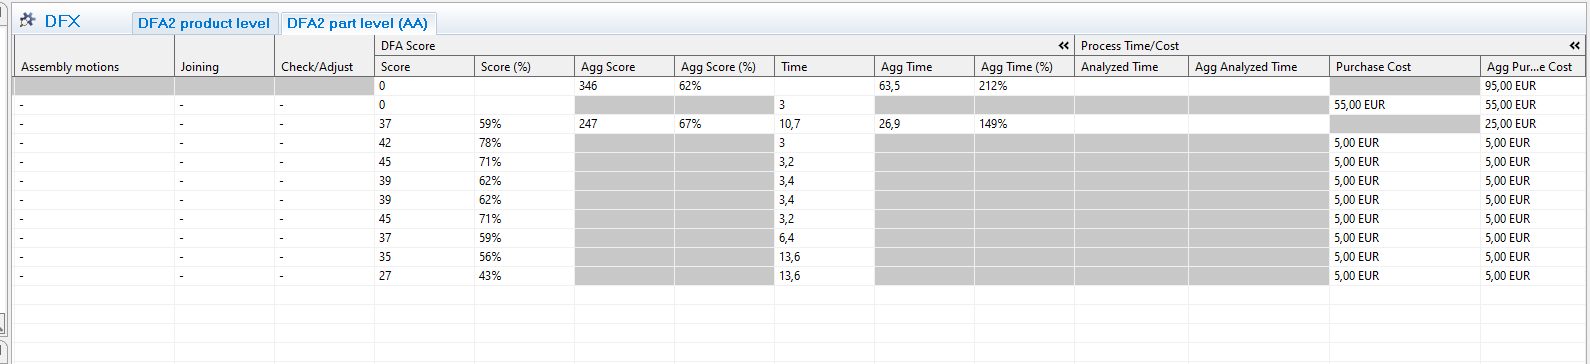
- Score: DFA score that can be compared with the same product in another state of design process
- Score %: number of points compared to the total number of points possible.
- Agg score: summary of all parts
- Agg score %: Should be at least 70% to get a good product. (score divided with total score)
- Time/
aggagg. time: Optimal time is 3 seconds and for some red and yellow answers it gives added time - Agg time%:
howHow many times longer is required to perform the assembly, (Ex 500% means 5 times longer thanoptimal)optimal according to DFAA standard)
There are currently two interesting reports that can be printed after completing a DFX analysis: the generic DFX report and the Notes report.
The DFX report, which is printable for all types of DFX analyses, is possible to print either by selecting a DFX analysis in the DFX view, or when the DFX analysis editor is open. The print action is accessible either via the print button in the main toolbar, or via “File ® “Print”.
The Notes report (a standard report available not only for the DFX module) is preferably executed by selecting the top-level Component of the BOM that has been DFX analysed. This will include all Notes for every Component below the top-level one. Once again, select Print but this time select the Notes report. For information about options concerning sorting and filtering when printing a Notes report please see Guide to Notes report under help in AVIX.
AVIX DFA KPI
DFA Score: Only to compare two designs of the same product
DFA score %: Compare between all products regardless of what, not to be below 70%
Time agg %: The theoretical time it takes to assemble a part/product in % compared to if it was optimal 3 sec.
Re-evaluating & Comparing two designs
After the initial DFX analysis of a certain BOM, different activities within the different disciplines (e.g. purchase, design) might have resulted in a proposed re-design of the product. It is thus a logical step to compare the “DFA index” for the original BOM with the new re-designed one.
Re-evaluating new design
As per methodology
COMPARING DFA SCORES
When comparing two designs it is noticeably that an improved design might have a lower DFA score than the original design. This is because eliminating a part will reduce the total score, making it difficult to compare designs using the DFA-score (Aggregated score) itself.
When comparing two designs, you can:
- Use the %-score (Agg Score %)
- Use the theoretical DFA-time
- Each DFX aspect generates a time based on a theoretical optimal assembly. Thus, comparing two designs where the new design has a lower DFA score it will also have a lower DFA time since it conatins less parts
- Each DFX aspect generates a time based on a theoretical optimal assembly. Thus, comparing two designs where the new design has a lower DFA score it will also have a lower DFA time since it conatins less parts
- Compare the total number of parts.
- Less parts will be a simpler (better) design
- Less parts will be a simpler (better) design