DFX analysis
To start working with the DFX analysis is straight forward:
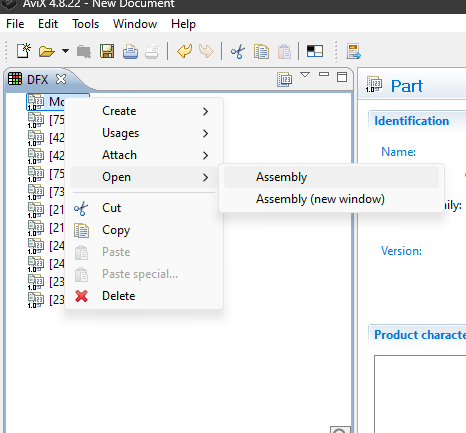
- Select the desired top part in the parts list and right-click "open in assembly view". The MBOM will now show in the assembly view.

- Select the product structure in the assembly view and the DFX palette will be available. You can now choose between the DFX at part-level or product-level.

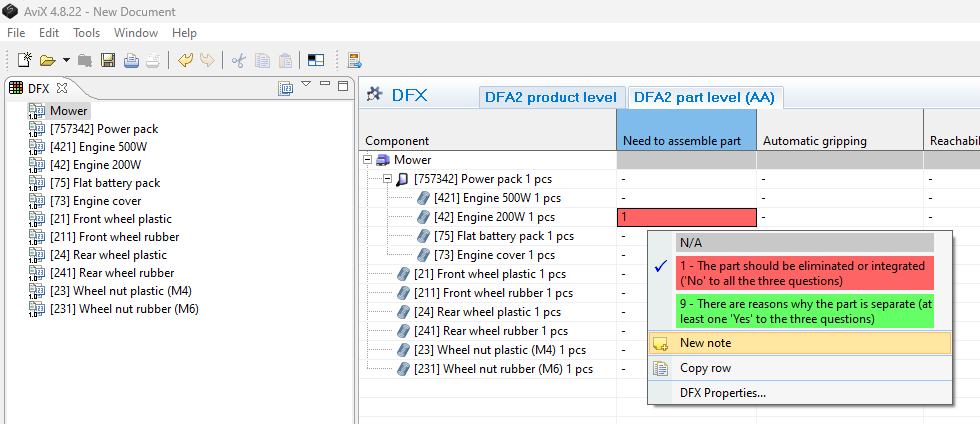
- The DFX analysis can now be performed by selecting the desired DFX aspect, and then right-click to evaluate the part
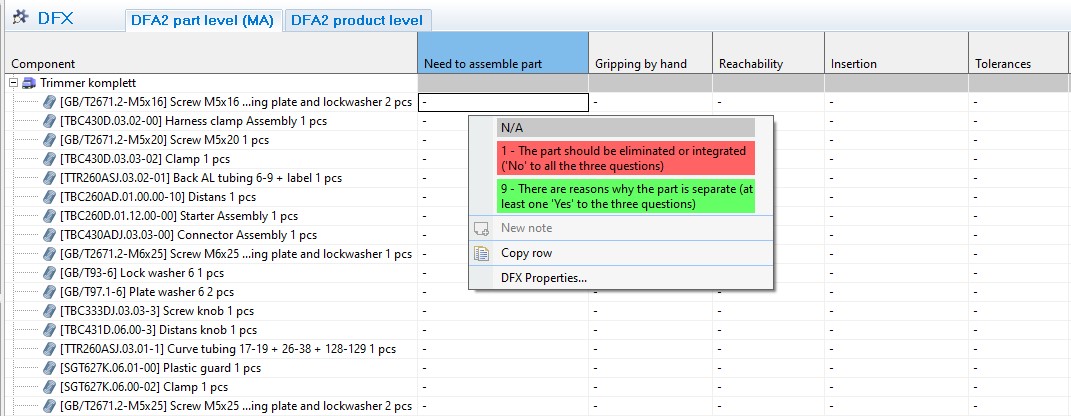
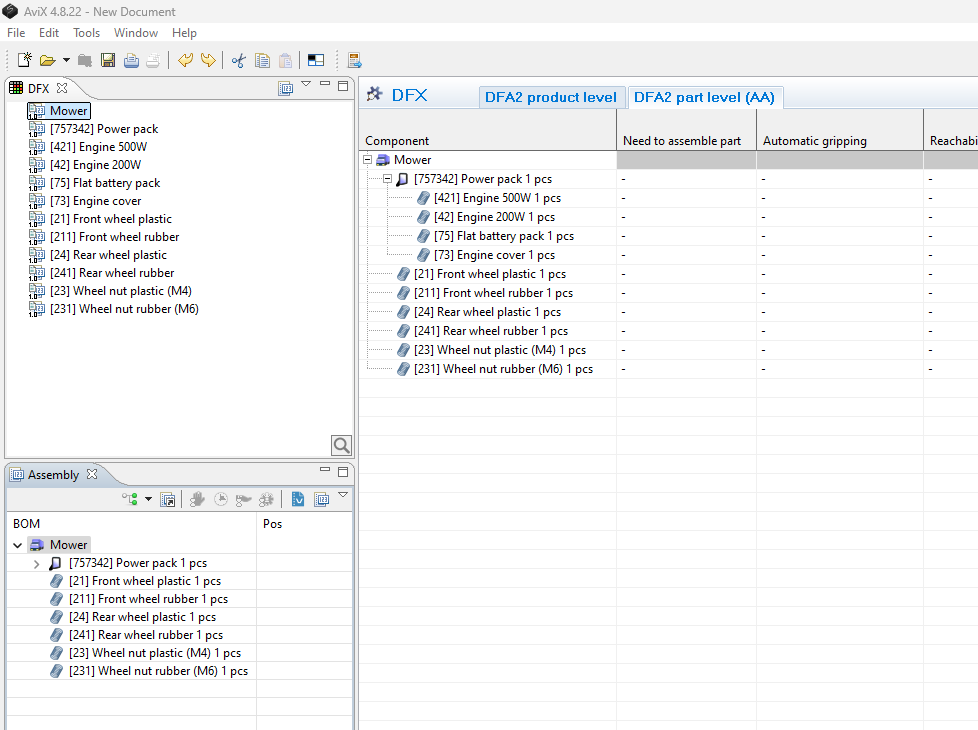

- The analysis editor has a grid layout, where the BOM structure (well-known from the DFX view) appears in the first column)
- The remaining columns in the grid are the DFX aspects in use, as well as two “result” columns which display specific score results.
- Analyzing a component for a certain aspect is carried out in one of the grid cells. This is done by the right-click menu, or simply by using the keyboard (e.g. by typing 9 for setting the highest score).
- Selecting N/A (Not applicable) is indicated by a grey cell.
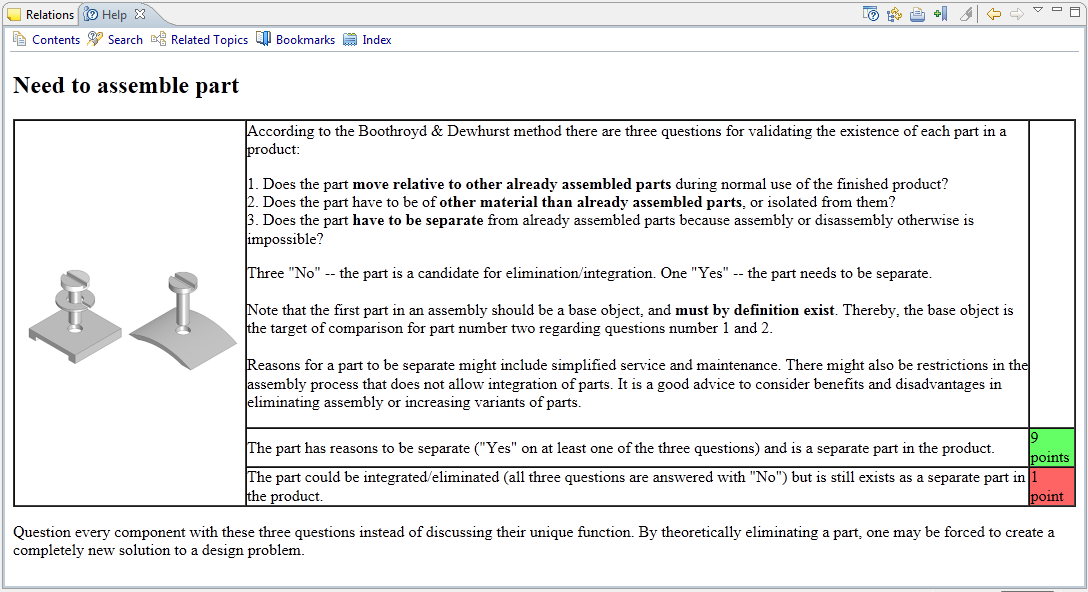
- The Help view (below), being in sync with the cell selection, displays the DFX aspect documentation
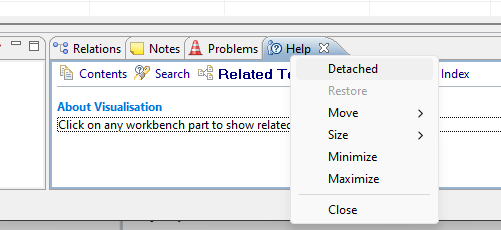
Help view
"Detaching” the Help view, making it a floating window frees up available screen space.
Note/action follow-up information
It is of significance for the follow-up work that the discussions and comments that typically arise during an “analysis session” are captured. This is, of course, even more important in the case of a problem: when the score of 1 is set for a Component, it is advisory to document the cause and what actions are to be taken. All this can be achieved by adding a “Note” (from the right-click menu in the grid), and entering the relevant information.