AVIX VALUE STREAM MAPPING: STEP-BY-STEP
Open AVIX and click on the "Balancing" icon in the top menu.

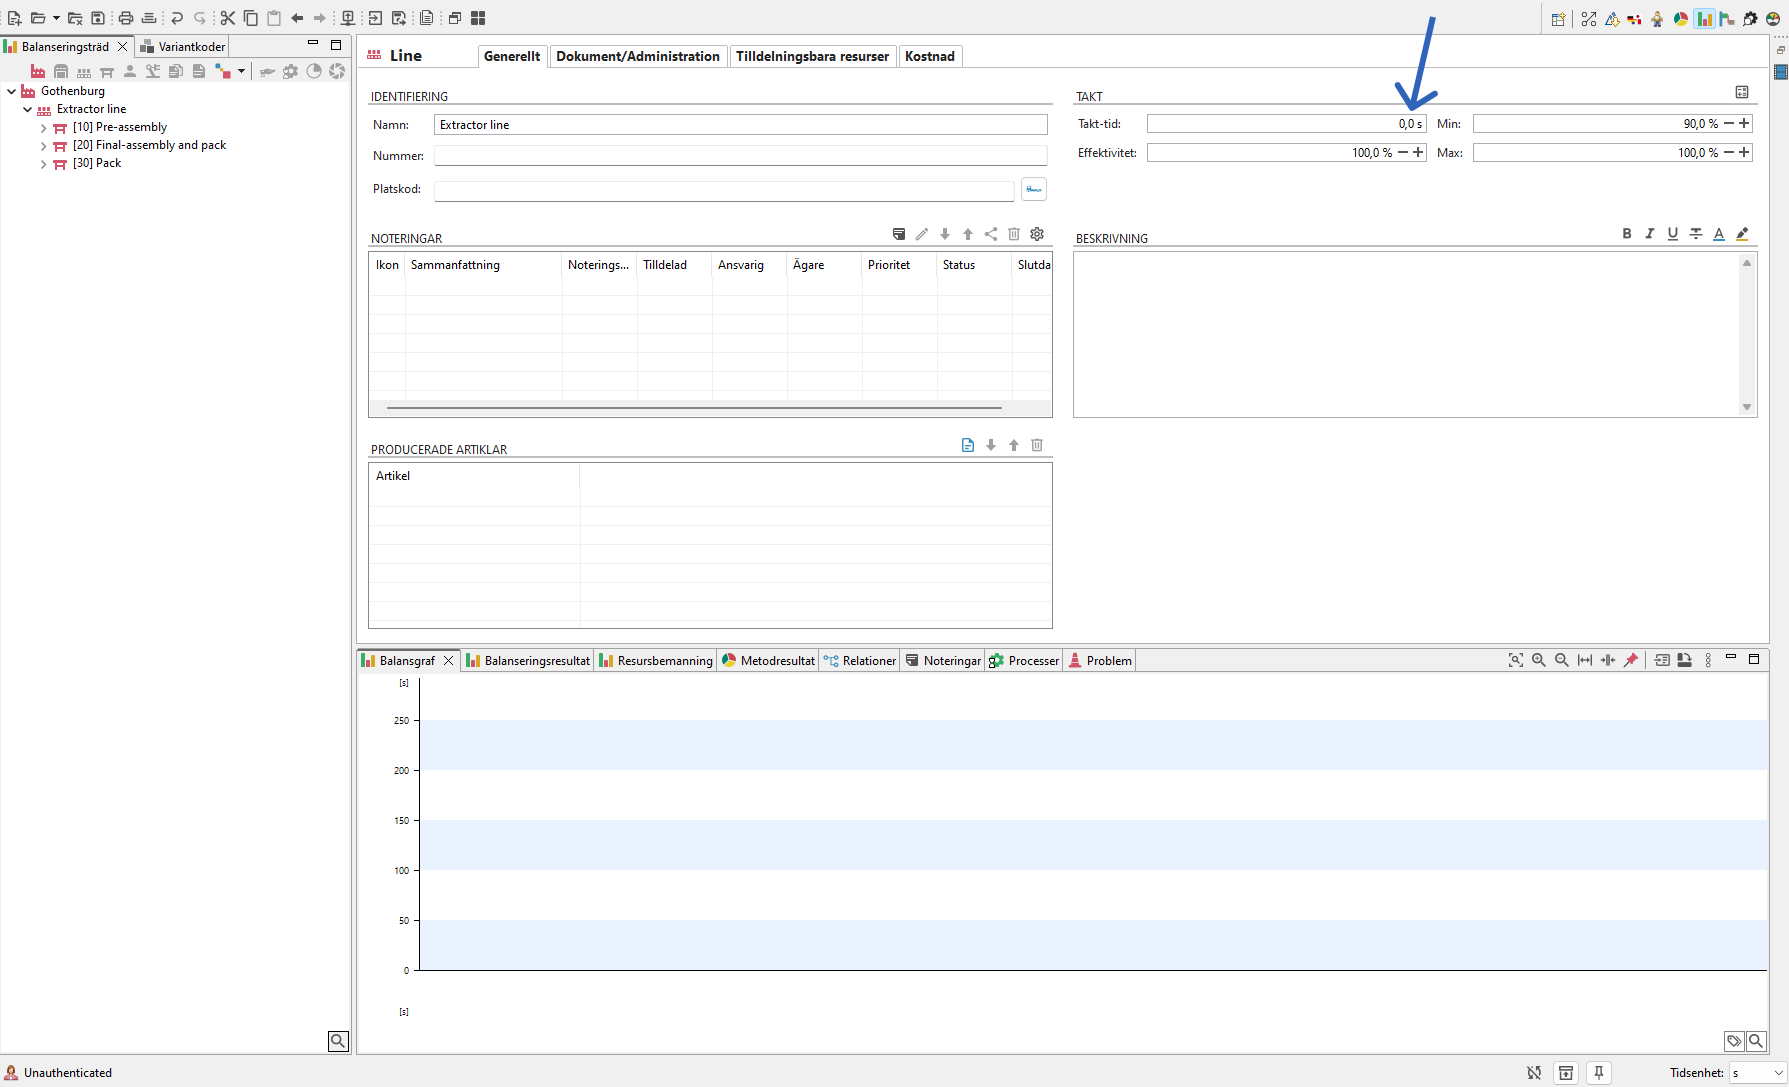
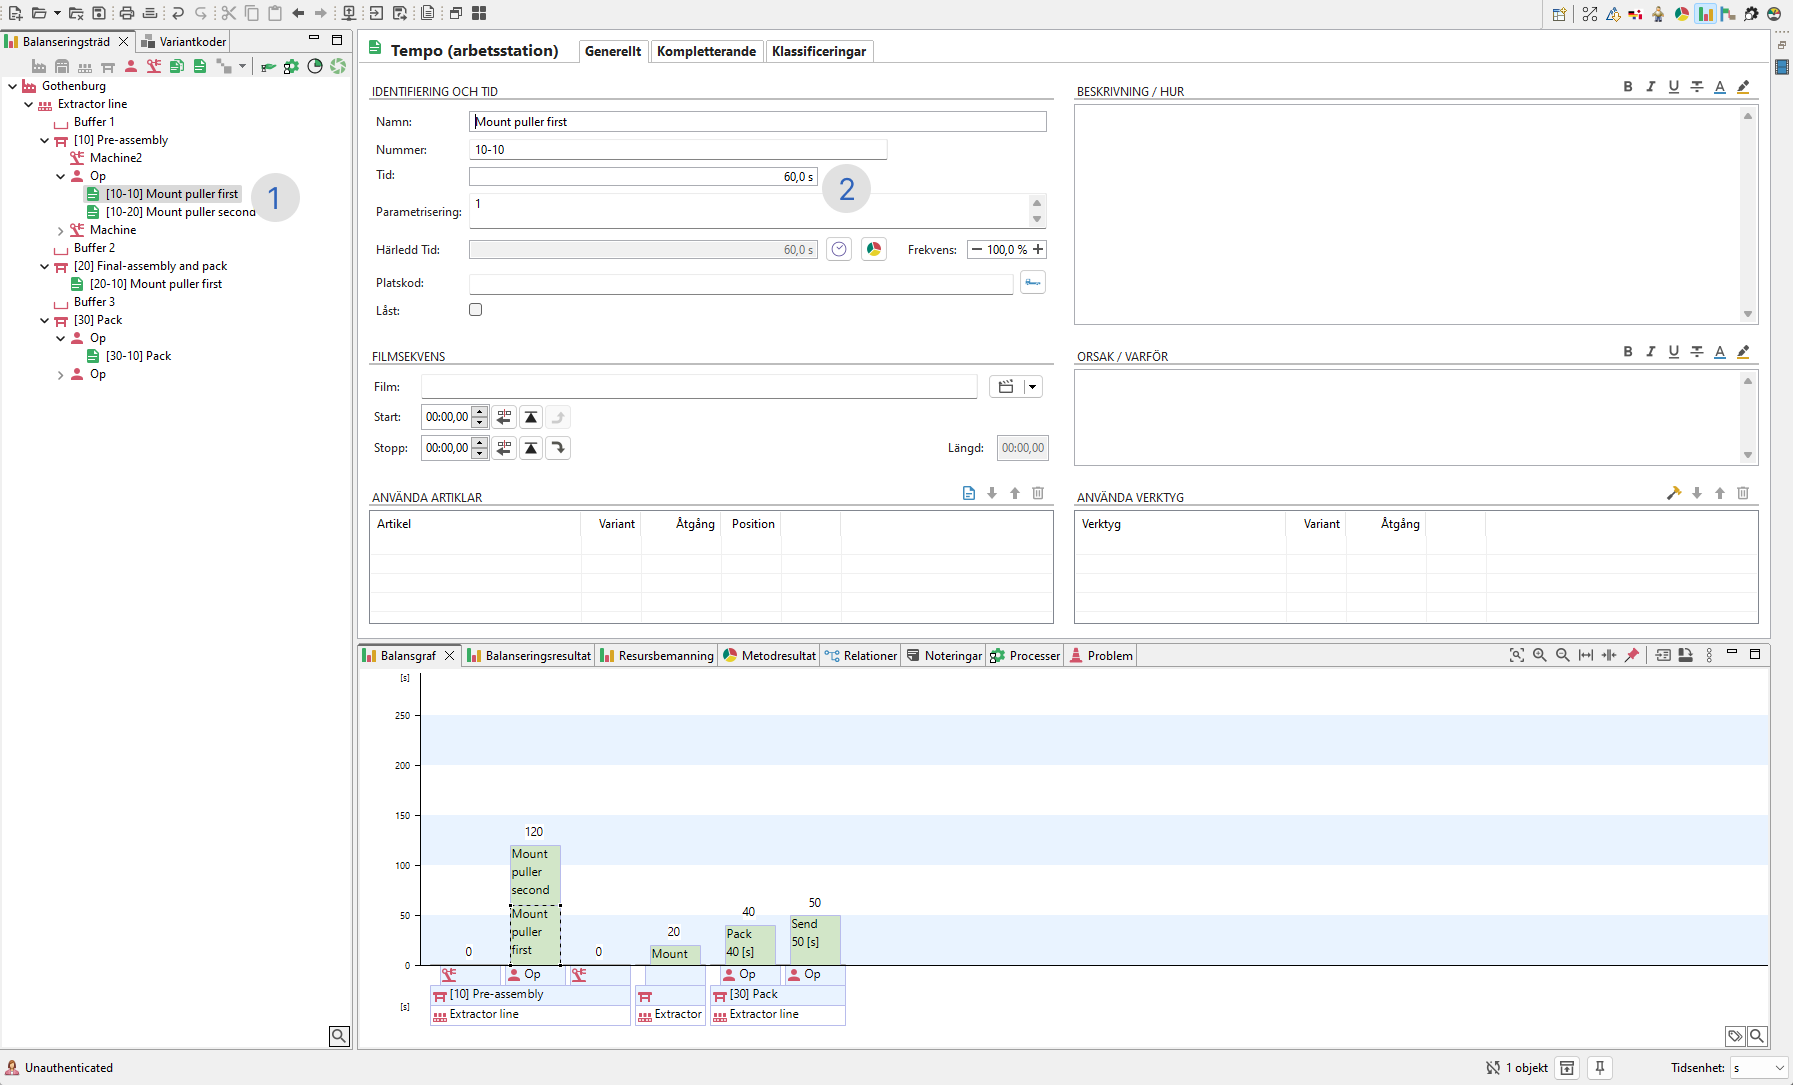
Picture 1: Default start layout of Balancing.
Setting Takt Time
Select the Line and fill in the Takt Time. Set Takt Time:
Enter the Takt Time directly if you know it.
Picture 2: Manual input of Takt Time
- Use the Takt Time Calculator to calculate it.
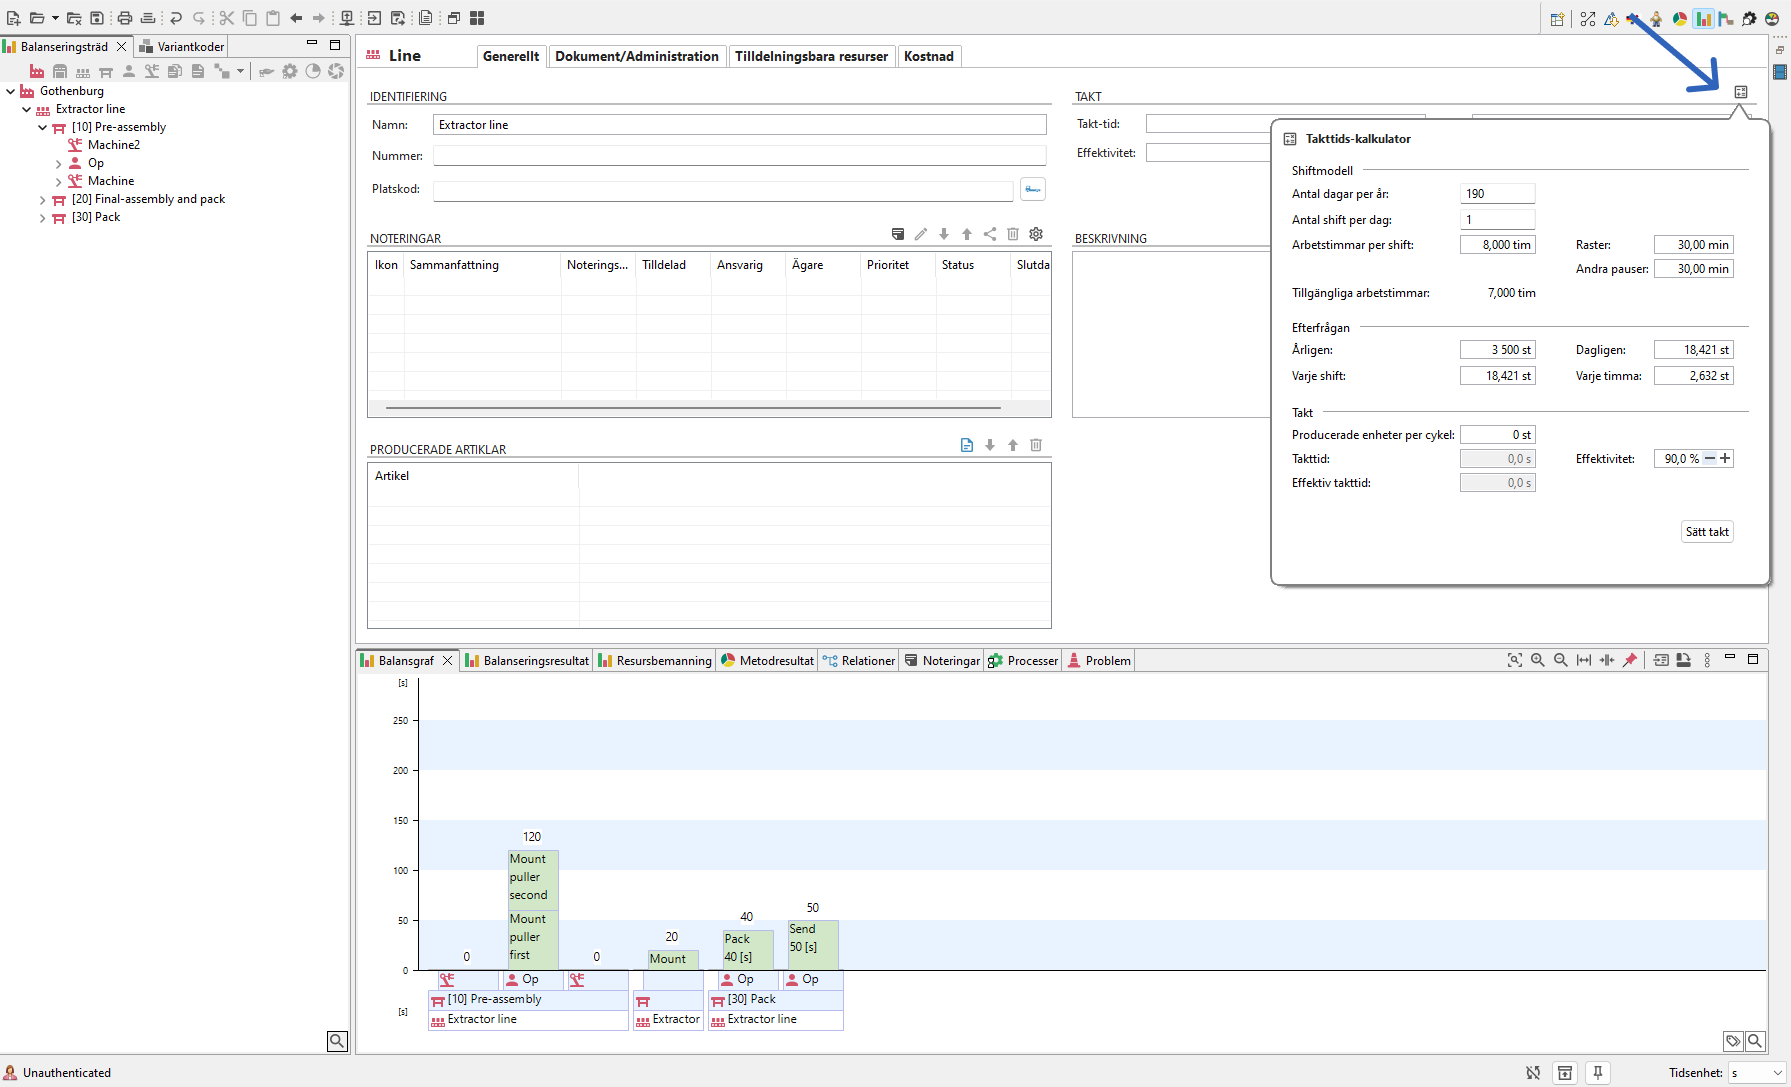
Picture 3:2: Click on icon to open Takt Time calculator and calculate Takt Time automatically.
Setting Parts Per Cycle
- Select the workstation.
- In the Workstation View, go to the "Cost and VSM" tab.
- Edit the following fields as needed:
-Scrap Rate
- Changeover Time
- Changeovers Per Day
- Select information arrows from the dropdown menu:
- Electronic, Manual, or None (default).
- Enter the Information Frequency text in the field below.
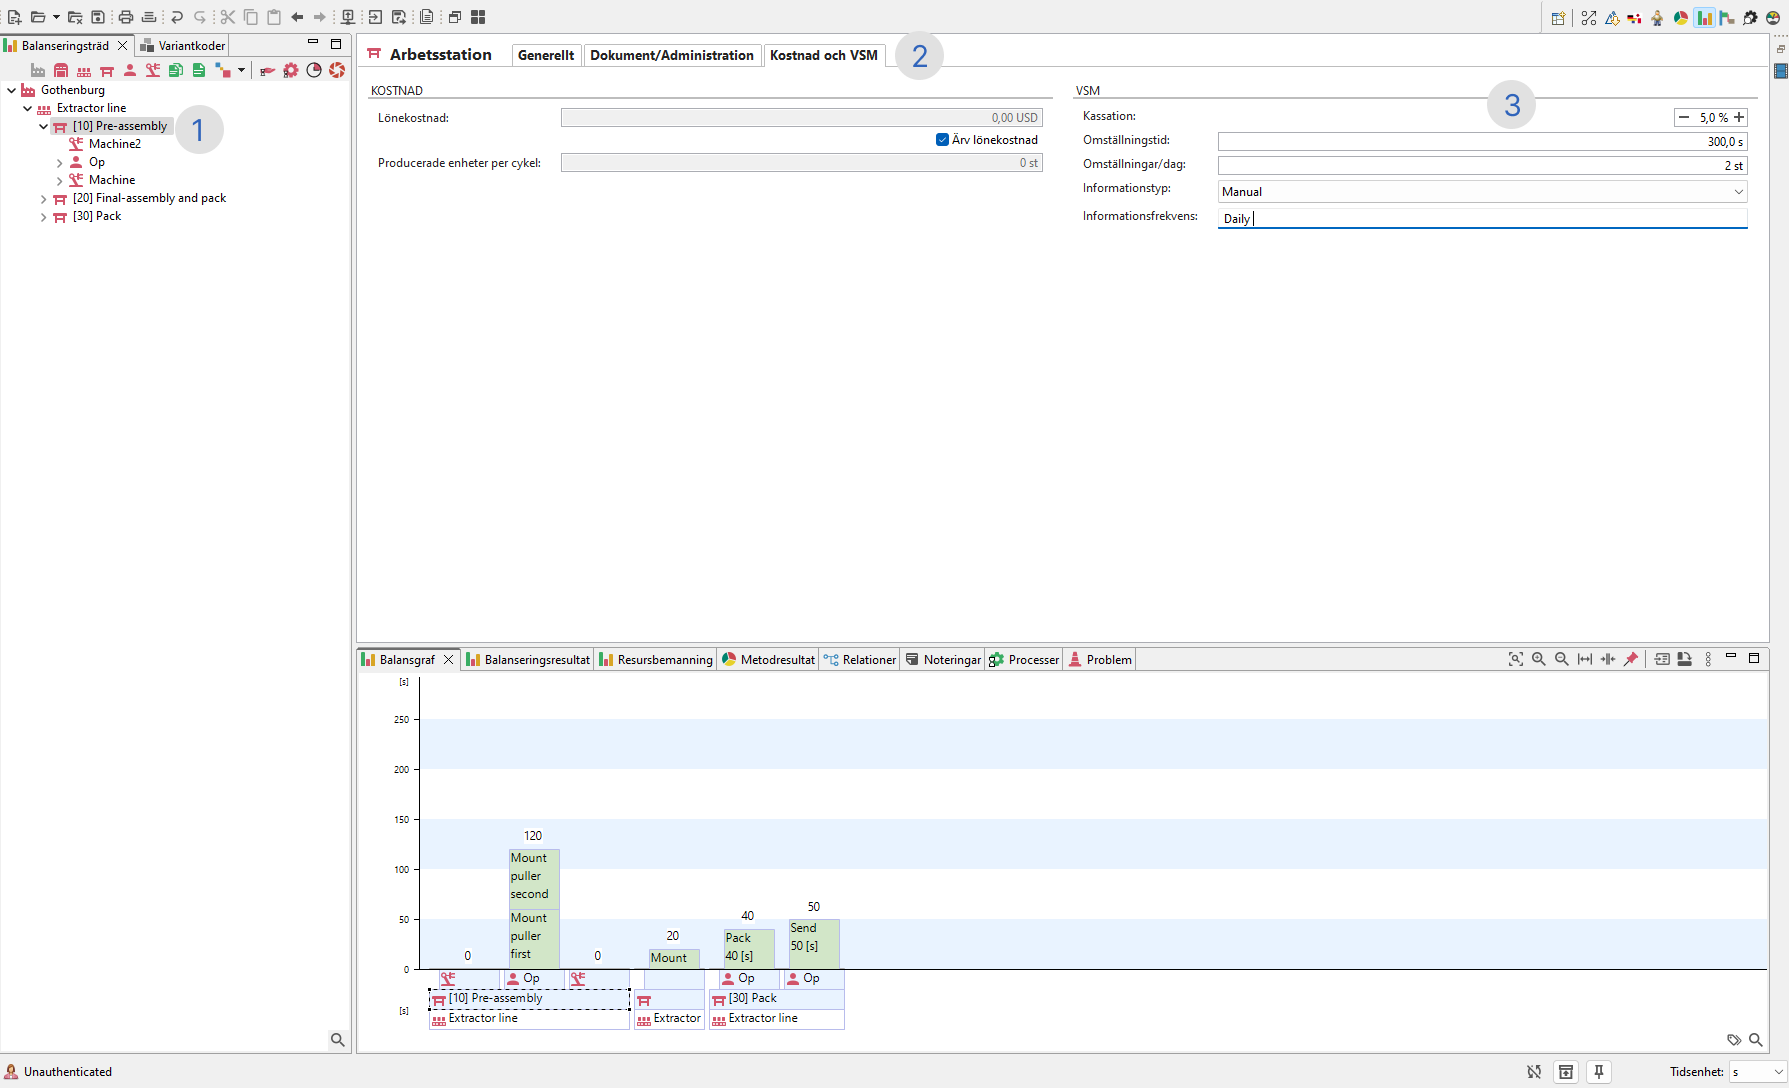
Picture 4:3: Steps for adding produced parts per cycle and information frequency on workstation.
Adding Buffer/Inventory
Right click on a workstation, then select "Create" > "Buffer".

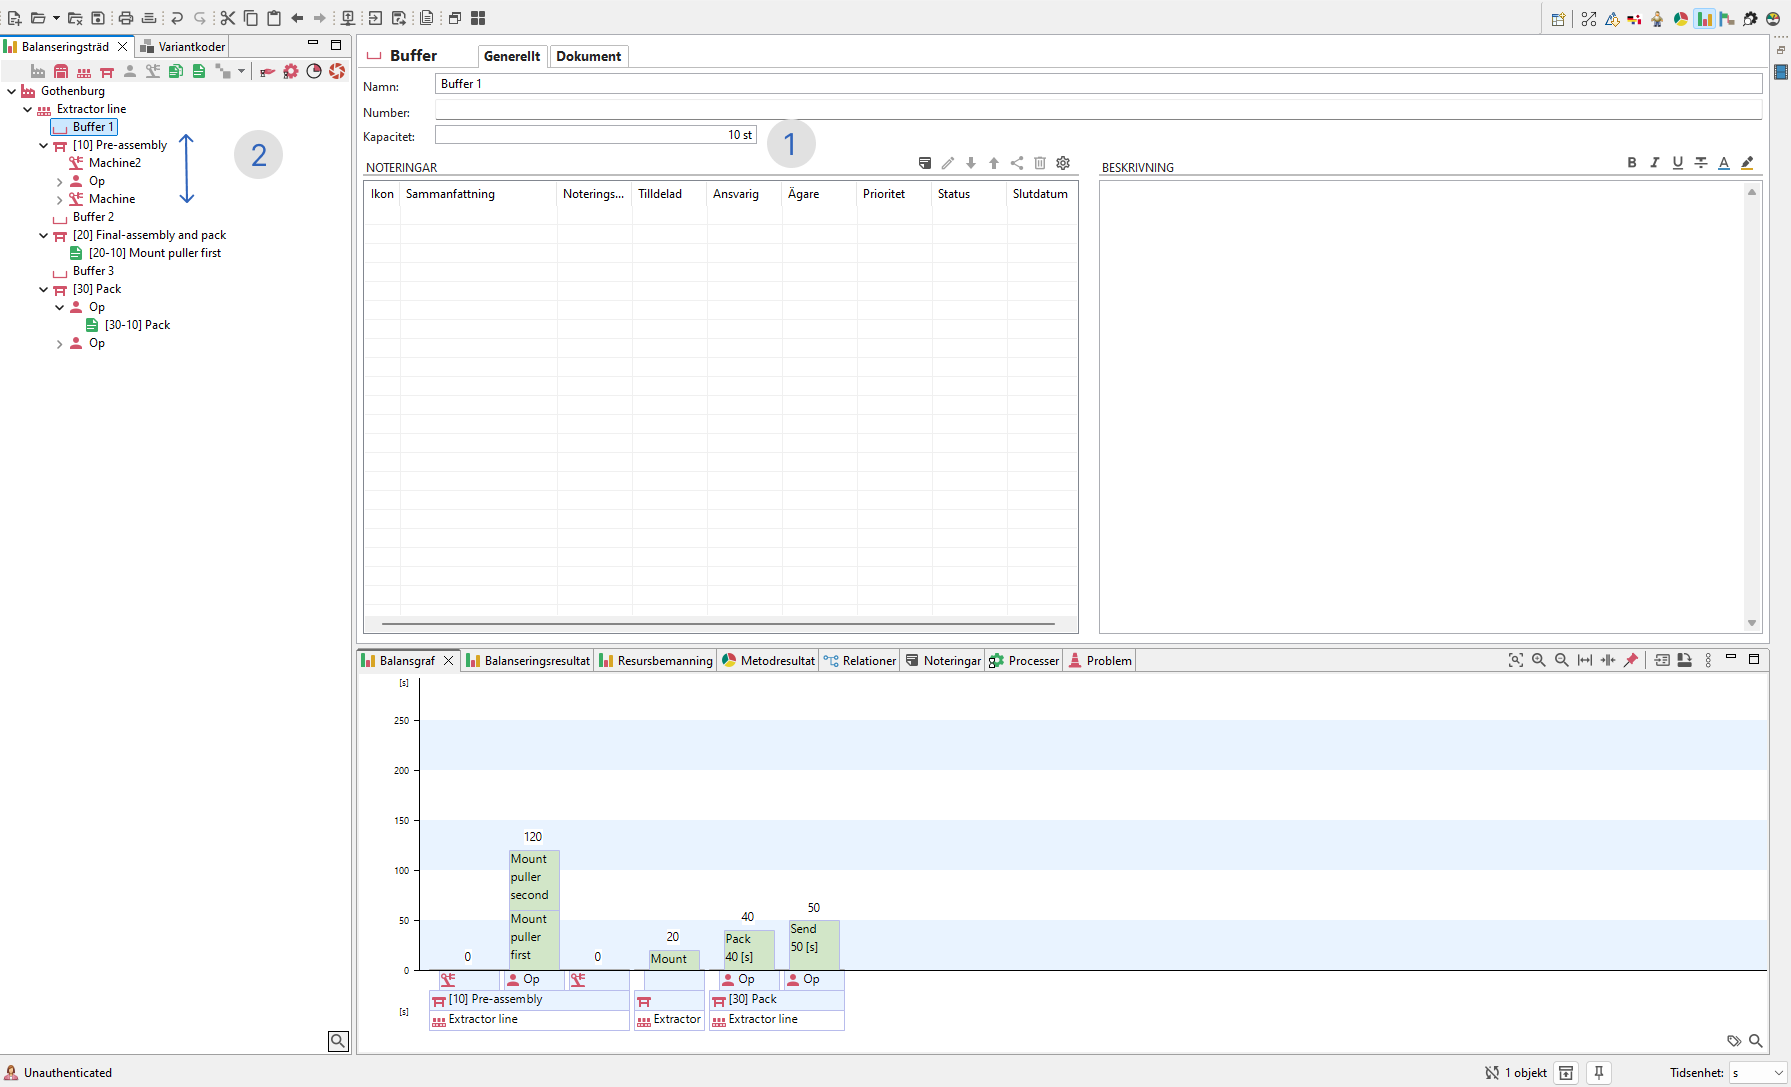
Picture 5:4: Right click on the workstation to add a buffer.
- In the Buffer View, set the Capacity, which will appear as inventory in the Value Stream Map.
- Drag and drop the buffer to adjust its position:
- Default: At the end of the workstation, representing inventory between stations.
-For a buffer before the first station, drag it to the top, a workstation can have two buffers (one at the top and one at the bottom).
 Picture
 6:5: Steps for 1. Add buffer Capacity, 2. Drag and drop buffer.
Setting Cycle Time
- Click on a task.
-
In the General tab, enter the Cycle Time in the Time field.
Picture 7:6: Steps to add Station Cycle Time.
Viewing the Value Stream Map on Shop Floor Viewer
Open Shop Floor Viewer. In the Browse page, select Value Stream Map from the dropdown menu.
Picture 8:7: Select Value Stream Map from drop down.

Overview: Value Stream Map
- Information Flow with arrows.
- Process boxes showing the workstation name and resources.
- data boxes with data.
- Timeline.
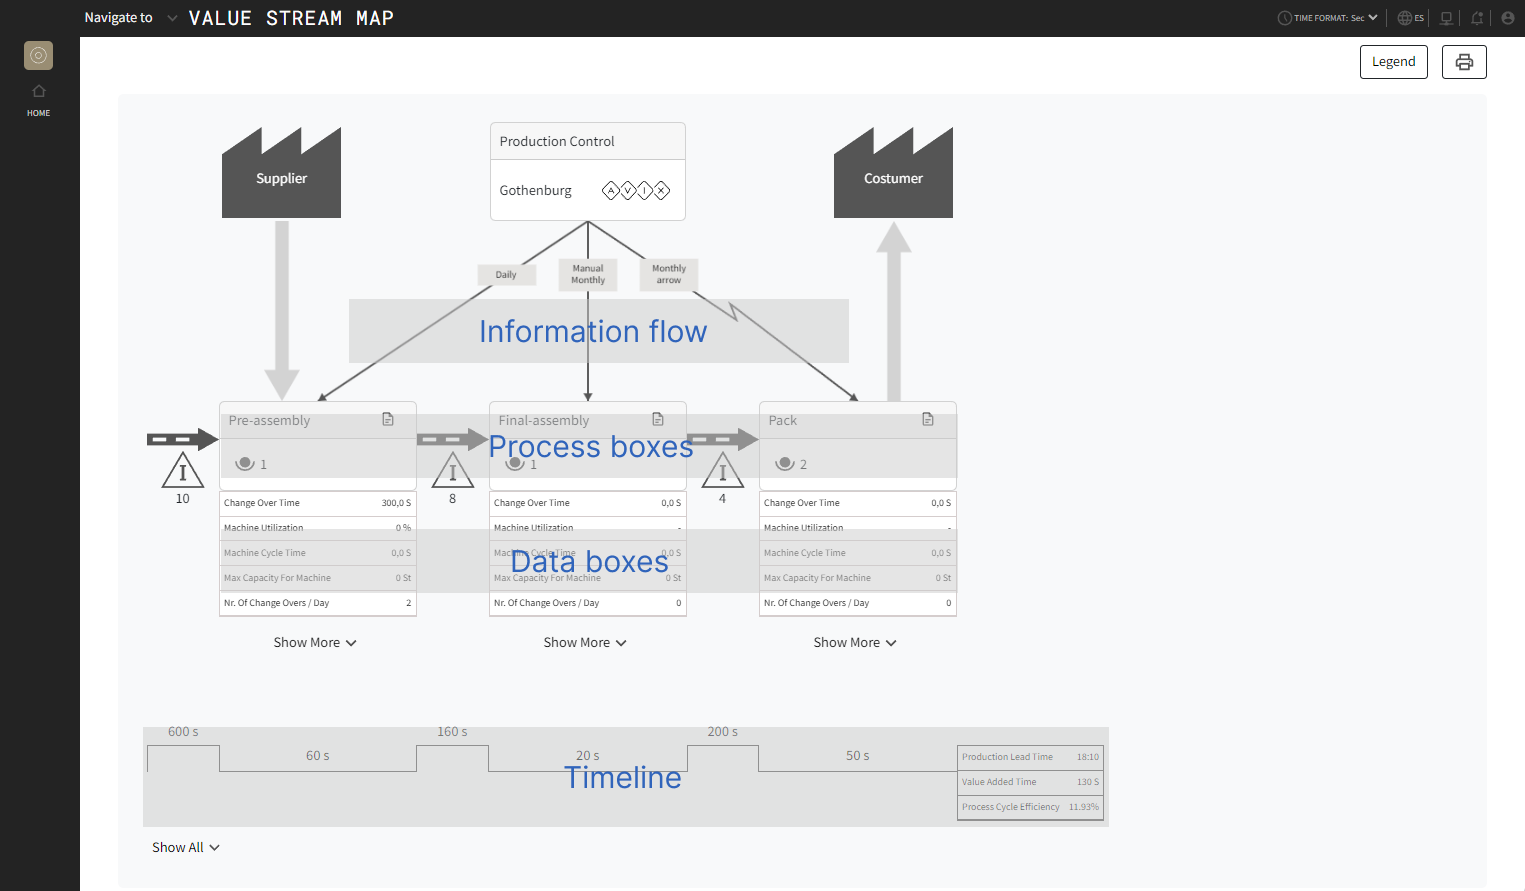
Picture 9:8: Overview describing the different parts of the Value Stream Map.
Process box:
- The document icon next to the workstation name is a link to its corresponding Work Instruction.
- If multiple resources exist, a dialog will appear to select which one. If only one resource exists, the dialog is skipped.
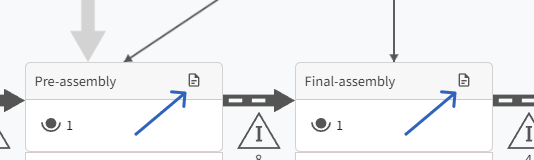
Picture 10:9: Shows the Document icon that naigates to the corresponding Workinstruction.
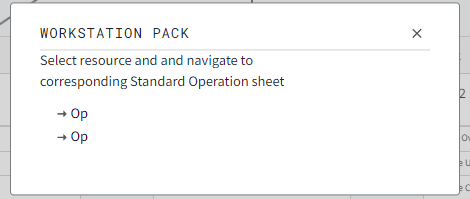
Picture 11:10: The dialog that pops up if there is more than one resource.
Data Boxes:
To show the workstation specific data use "Show More" to expand an individual station or "Show All" to expand all stations.
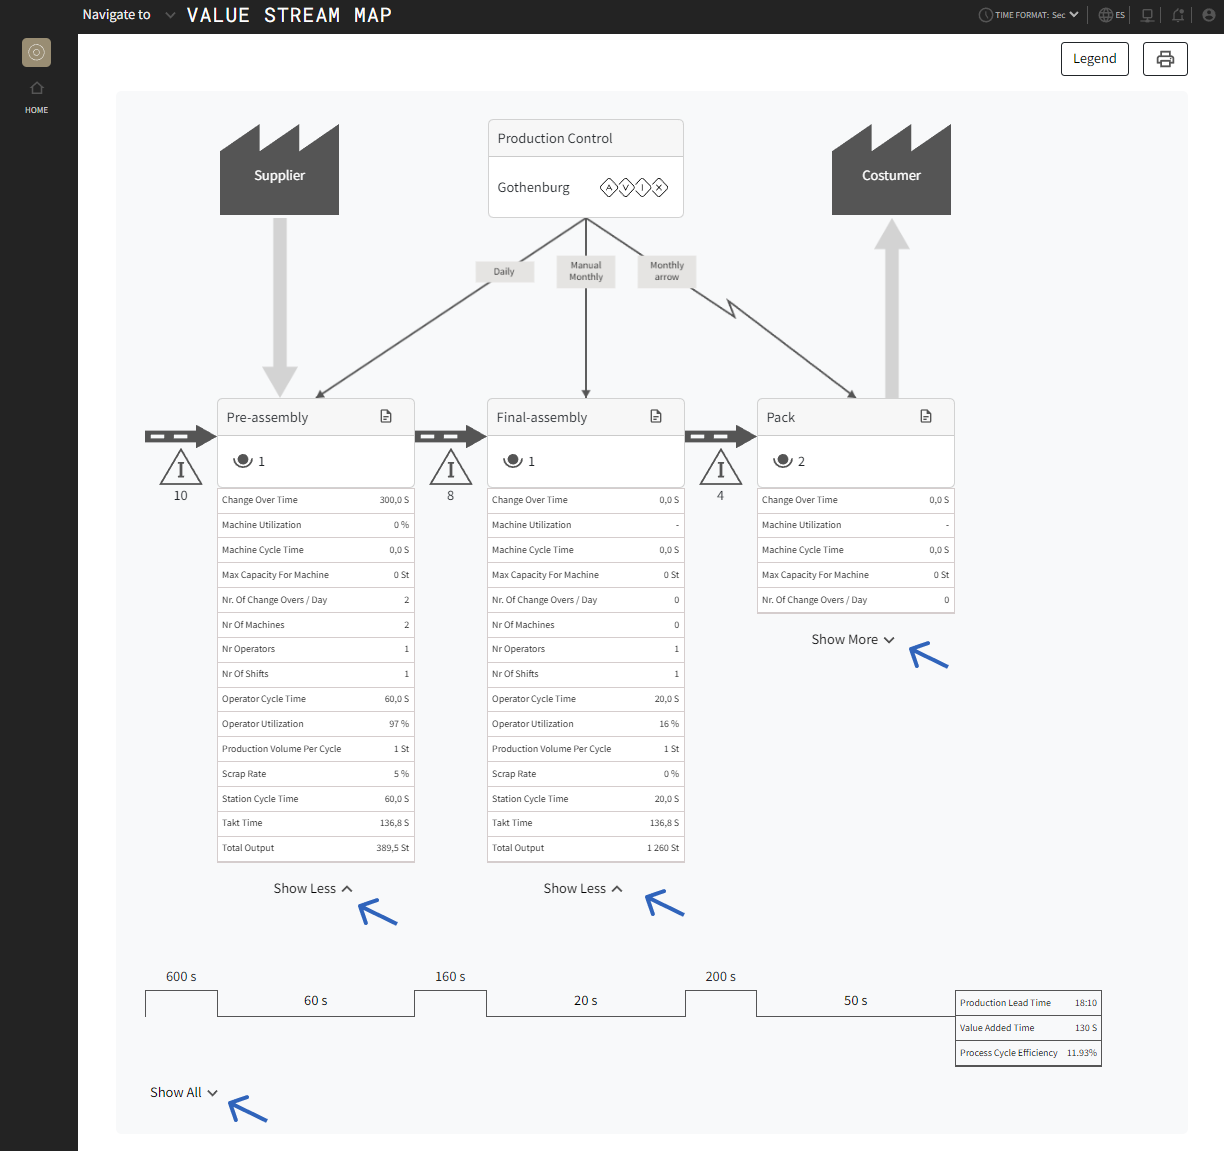
Picture 12:11: Toggle data boxes to show all rows of data, either by clicking on indiviudal workstations or by clicking on Show All.
Additional Features:
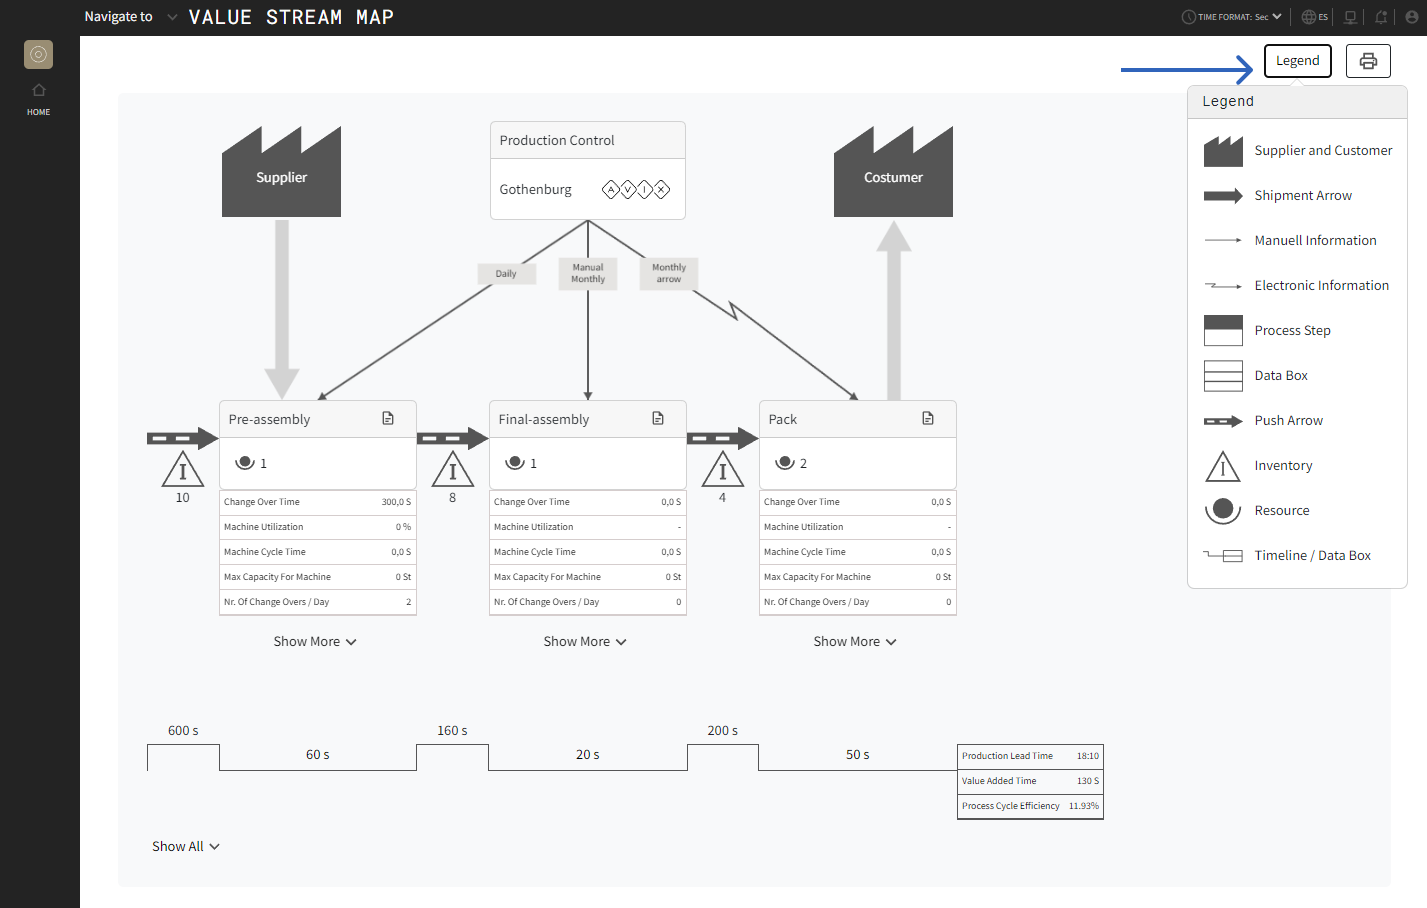
Picture 13:12: Describes the icons on the chart.
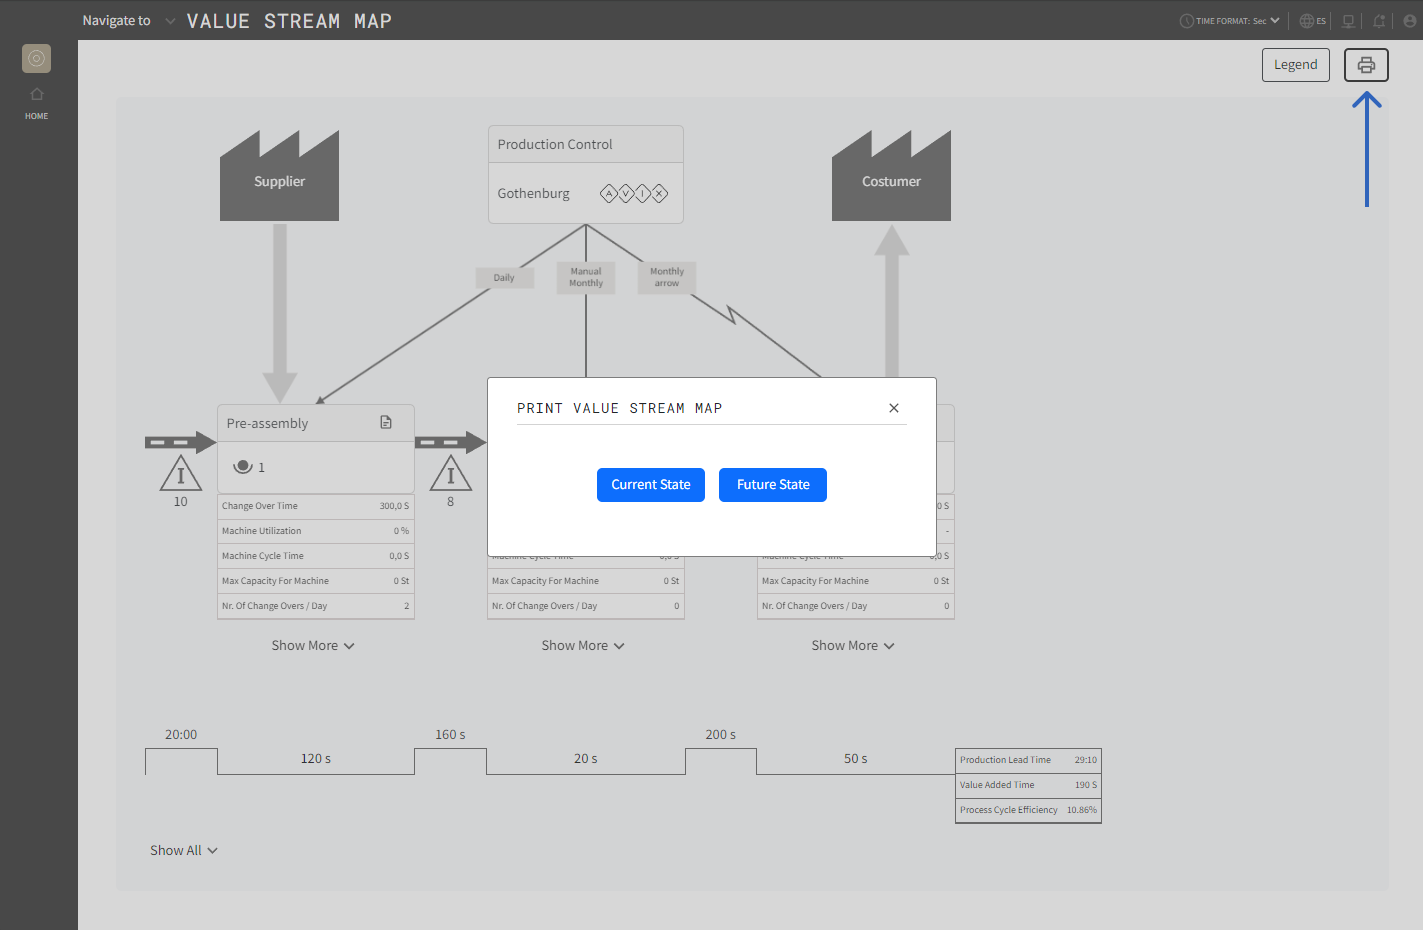
Picture 13: Print either Current or Future state.
Picture 14: Current state (left): Print the VSM as it is. Fututre state (right): Adds an empty column next to data boxes.

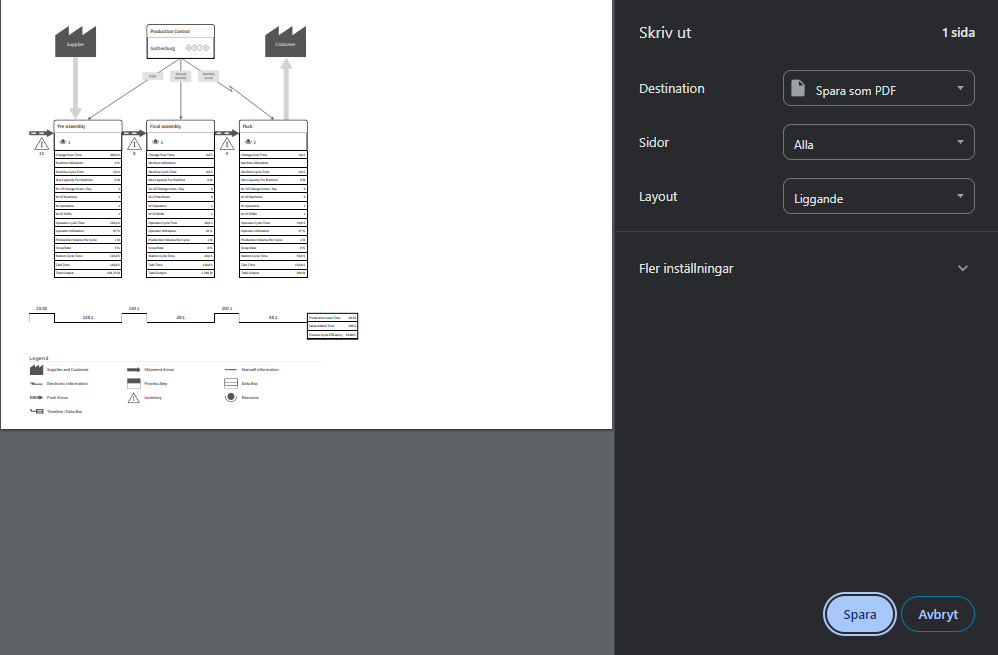
Tips: Printing settings for best result
-
Layout: Landscape
-
Paper Size: A3
-
Scale: 50%
-
Background Graphics: checked (if this is not set the icons on the chart might not be visible)