The UAS module in AVIX
Users familiar with other time analysis modules (AviX Method, AviX SAM etc) in AviX will see that the outline when using UAS is identical.
When AviX is running you switch to Method perspective (module) by pressing on the Method-icon  . The default appearance of AviX UAS looks like below (Figure 1).
The different views or windows will be explained throughout this guide, but let’s start with a quick overview of the view outline:
The Method Tree view in the lower left corner is where your plant structure with the assembly process tasks is presented. In addition to base structural components such as Factory, Line and others, all available time analysis methods (AviX Method, MTM-SAM, MTM-UAS) can be created and organized in this view.
The Method result section shows the analyzed time result of the objects selected in the Method Tree.
Relations display related information for the objects that are selected in the Method Tree view. This is where attached Documents and written Notes are presented.
Media Player is where the related video is being visualized. In addition to process tasks, video capabilities are also possible for any type of time measurement method, such as for instance MTM-UAS.
Detailed explanations of all generic views and features can be found in the user manual.
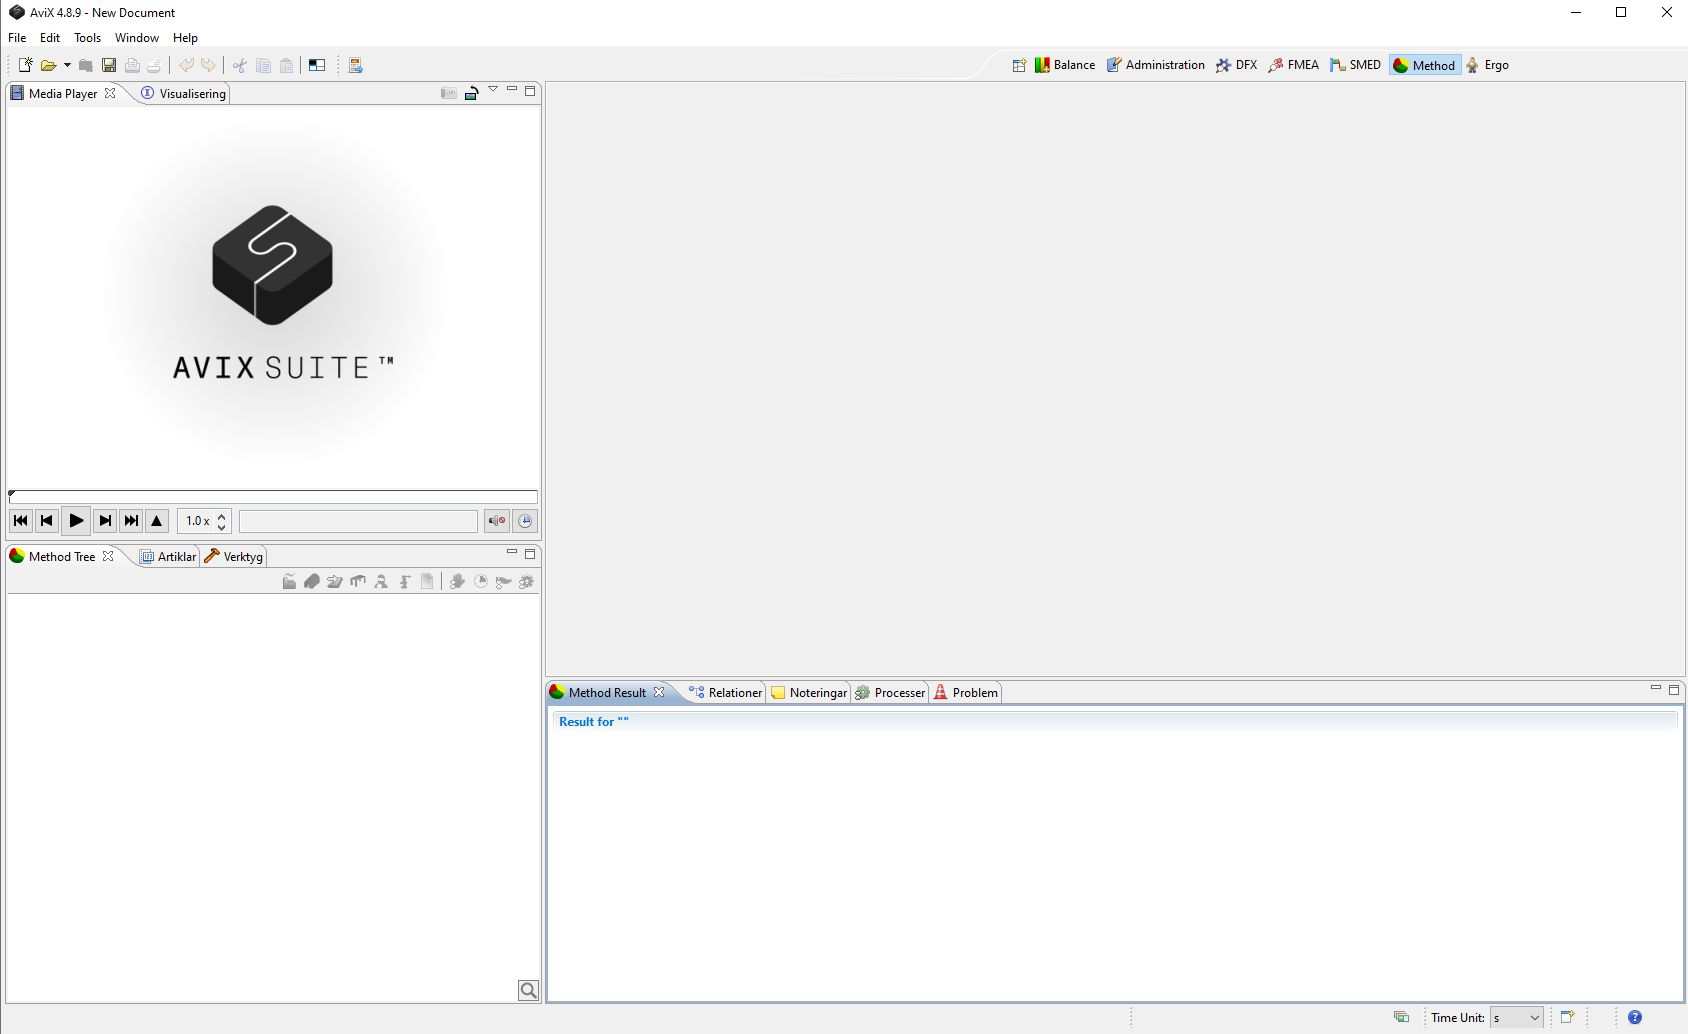 The default appearance of AviX UAS.
Performing a MTM-UAS time analysis
There are two different types of UAS time analysis; Summary analysis and Process analysis.
Summary analysis
The summary analysis editor is opened by clicking on an existing UAS summary analysis in the Method Tree, or alternatively by creating a new UAS summary analysis, using the designated button ![]() in that same view.
in that same view.
The UAS summary analysis editor (below) consists of two main parts; the part at the top which is generic for all analysis methods, which connects the analysis to movie information, objects and aids, and manages instruction and repetitions of the analysis. The section below focuses on the time analysis itself, UAS-codes and description for each row. New rows is added by clicking on the -icon, a row is deleted by clicking on the
  -icon.
The UAS editor consists of two sections; the top one contains information of movie, objects and aids. The bottom section is used for description and UAS-code for the work.
Filling in Values
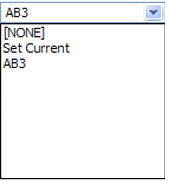
Analyzed sequences are documented by setting a UAS-code in the column for codes. This is performed by setting focus on the box by left clicking within its borders and performing either one of the following actions:
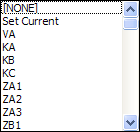
- Select a code from the drop down list.

- Type a valid code in the cell and select “set current”.

- Right-click and select desired code via sub-menus.
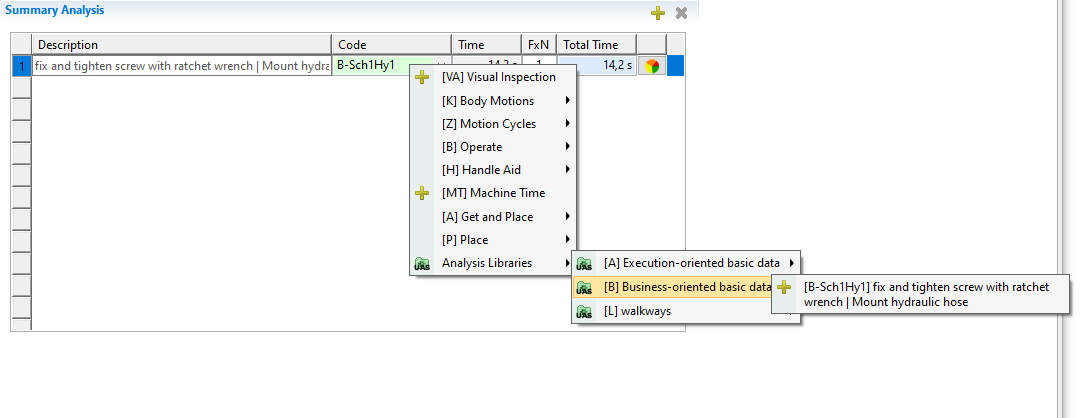

A valid code, a code that exists, will make the cell change color from white to green. An invalid code, a code that does not exist, will make the cell change color from white to red. One valid and one invalid code is seen in Figure 3 below.
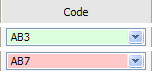
AB3 is a valid code, hence the background color is green. AB7 is invalid; hence the background color is red.
The description of the process performed is written in the column Description.
FxN is applied by entering an integer or a decimal number. Another possibility is to use the UP/DOWN arrows on the keyboard, which increase and decrease the selected value by one respectively. For quick access, it is also possible to increment the current value by double-clicking the left mouse button.
The time unit is set in a cell by right-clicking and selecting desired unit.

A screenshot of a row in a UAS analysis block.
Process analysis
A process analysis is a template analysis which can be used in a summary analysis. A work sequence that is performed the same way each time regardless of the surrounding context is typically analyzed in a process analysis. Once the process analysis is defined it can be used over and over again in different summary analysis.
Creating a Process analysis
A process analysis can only be created in the Process view, see Quick start guide for details on how to open and manage views in AVIX.
Create a new UAS process folder by clicking on the  -icon, the folders´ details are edited in the editor view (the top right view).
Create a process analysis by clicking on the  icon. This will open the process analysis for editing in the editor view.
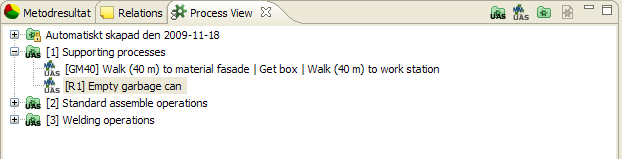
Perform the process analysis, this is done analogous with a summary analysis. However, a Process analysis needs a unique code. The code can be of any format and is used in the summary analysis to include a process analysis. The processes can be organized with folders to divide the process analyses in logical groups (below). The following picture is showing a process analysis and its code, Get material 40 meters away (GM40).
The processes tab with UAS-folders and UAS process analysis.
In the summary analysis the first row is GM40 (the process analysis from Figure 6). The second row is a UAS standard code, PC2.
Parameterization of process analysis
A process analysis can be used with a parameter, which applies a multiplicator to an analysis row. The parameter is added to a process analysis by right-clicking in the cell FxN (Figure 8).
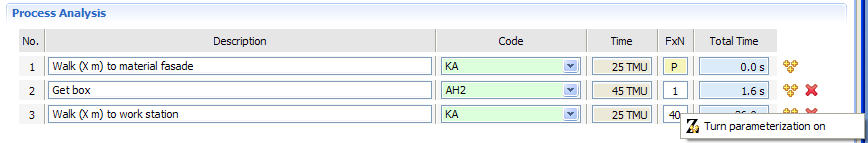
The parameterization of a row in a process analysis is turned on by right-clicking in the cell FxN.
Setting parameter value in a summary analysis
In the summary analysis, the parameter value is set by right-clicking on the parameterized process code (Figure 9). This will open a dialog where the parameter is set (Figure 10).
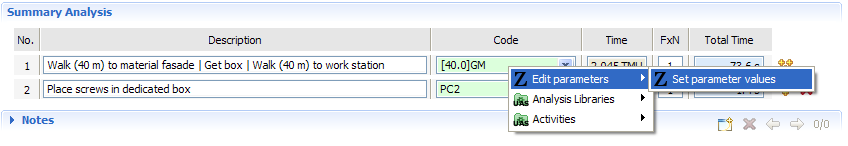
The parameter value is set by right-clicking on parameterized code.
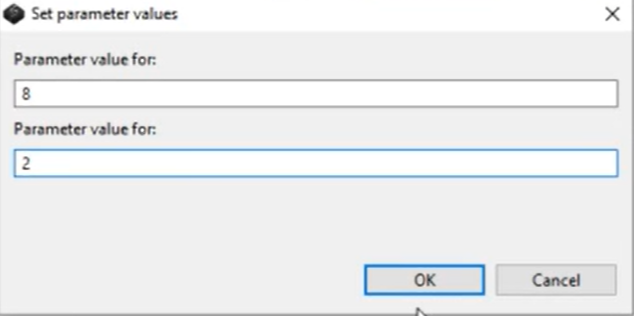
Dialog for setting a process analysis parameter.
Method Result Classification for UAS
The AviX Method result view has inherent support for classifying analyzed time in different categories and color-coding these for easy overview. Classification for UAS analysis objects is currently limited to considering all time as unspecified UAS analyzed time.
Follow up – UAS Report
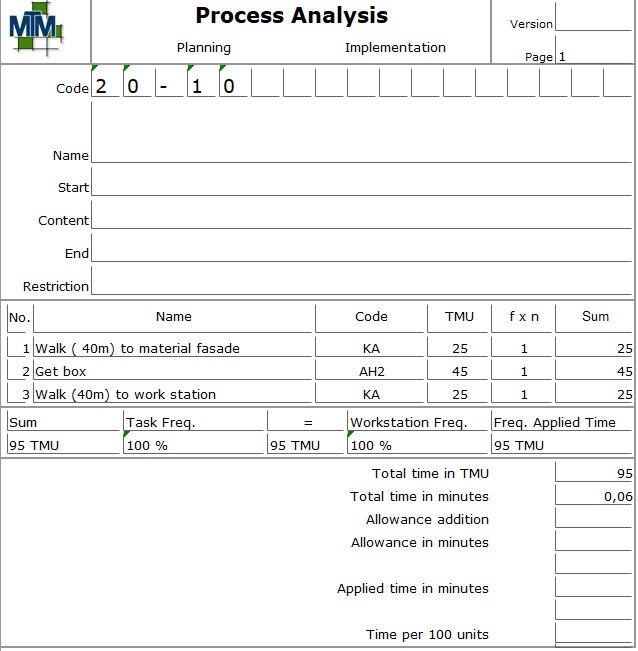
Currently, one report exists within AviX UAS. It will give you a quick overview of the selected Workstations and Process Tasks.
This report can be printed by selecting one Workstation or a set of process Tasks in the Method Tree, and running the Print action (File Print...).
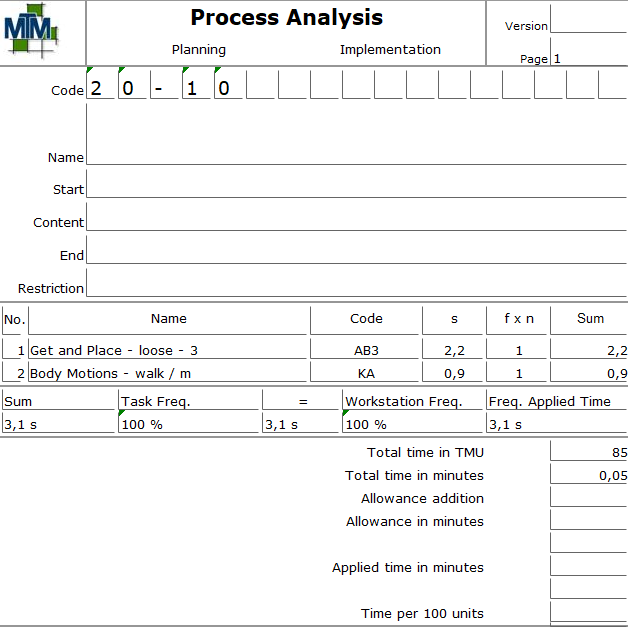
The report will contain one page per Process Task. Apart from the report header, each page contains a label with the activity information, descriptions of each analysis row, the input data set on each row, and summary time analysis information. This report is created to mirror traditional paper-based UAS analysis sheets closely.
MTM UAS Data Card
|
Get and Place |
Dist. in cm |
<= 20 |
>20 <=50 |
> 50 <=80 |
||
|
Code |
1 |
2 |
3 |
|||
|
<= 1 daN |
Easy |
Approximate |
AA |
20 |
35 |
50 |
|
Loose |
AB |
30 |
45 |
60 |
||
|
Tight |
AC |
40 |
55 |
70 |
||
|
Difficult |
Approximate |
AD |
20 |
45 |
60 |
|
|
Loose |
AE |
30 |
55 |
70 |
||
|
Tight |
AF |
40 |
65 |
80 |
||
|
Handful |
Approximate |
AG |
40 |
65 |
80 |
|
|
> 1 <= 8 daN |
Approximate |
AH |
25 |
45 |
55 |
|
|
Loose |
AJ |
40 |
65 |
75 |
||
|
Tight |
AK |
50 |
75 |
85 |
||
|
> 8 <= 22 daN |
Approximate |
AL |
80 |
105 |
115 |
|
|
Loose |
AM |
95 |
120 |
130 |
||
|
Tight |
AN |
120 |
145 |
160 |
||
|
Place |
Code |
1 |
2 |
3 |
|
Approximate |
PA |
10 |
20 |
25 |
|
Loose |
PB |
20 |
30 |
35 |
|
Tight |
PC |
30 |
40 |
45 |
|
Operate |
Code |
1 |
2 |
3 |
|
One Single Operation |
BA |
10 |
25 |
40 |
|
Compound Operation |
BB |
30 |
45 |
60 |
|
Handle Aid |
Code |
1 |
2 |
3 |
|
Approximate |
HA |
25 |
45 |
65 |
|
Loose |
HB |
40 |
60 |
75 |
|
Tight |
HC |
50 |
70 |
85 |
|
Motion Cycles |
Code |
1 |
2 |
3 |
|
One Motion |
ZA |
5 |
15 |
20 |
|
Motion Sequence |
ZB |
10 |
30 |
40 |
|
Shift & One Motion (with Reposition) |
ZC |
30 |
45 |
55 |
|
Fasten or Loosen |
ZD |
20 |
||
|
Body Motions |
Code |
TMU |
|
Walk / m |
KA |
25 |
|
Bend, Stoop, Kneel, incl. Arise |
KB |
60 |
|
Sit and Stand |
KC |
110 |
|
Visual Control |
VA |
15 |