Stopwatch Sampling
In cases where a more detailed stopwatch analysis is needed, the extended AVIX stopwatch palette can be used. This requires the module AVIX Stopwatch time Study.
Watch video: Stopwatch analysis
The functionality is quite straight forward, with or without a movie a number of measurement samples can be done. Each sample also gives the option to set a work rating if used.
The sum of all samples gives the mean time and also calculates the standard deviation of the measurements. This can be used to check if the sample size is big enough. Finally, a factor for allowance can be set if used.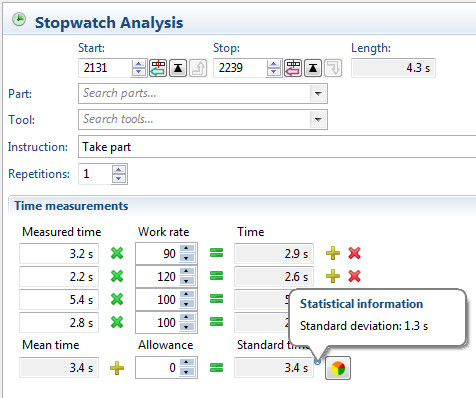
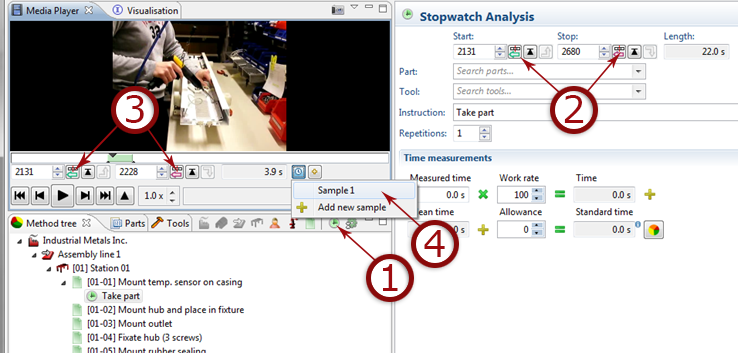
- Create stopwatch operation.
- Define length (start/stop) for operation using
 and
and 
- Measure time by defining where the measurement starts and ends using and
- Add measured time to sample.
The steps above can then be repeated to create several different samples.
Note, to use several samples, it’s a good idea to let the operator repeat the same step during the same movie sequence. This makes it much easier when measuring the samples, because each task in the sequence will contain all the necessary samples.
Note, there is difference between the buttons  and
and  depending on where they are located. The buttons below the movie player are used to measure time between two points in the movie.
Ways to calculate SAMPLE time
The sum of the samples can be calculated in different ways
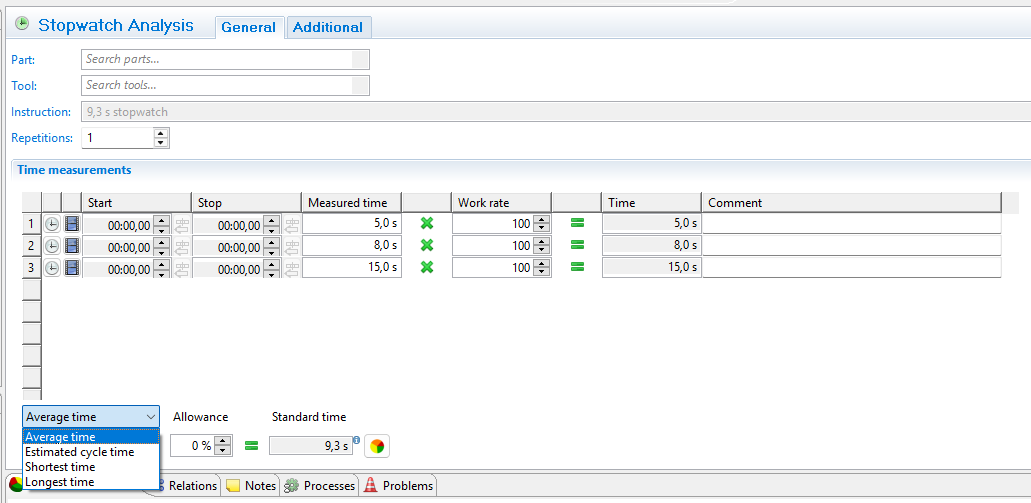
Average time
The average, total sum divided by the number of samples
SHORTEST TIME
The shortest time of the samples
LONGEST TIME
The longest time of the samples
ESTIMATED CYCLE TIME
In AVIX, the cycle time is the lowest time that something can be done repeatably.
”Lowest time” assures that the waste time is kept at a minimum.
”Repeatably” assures that it was not a coincidence but can be done multiple times.
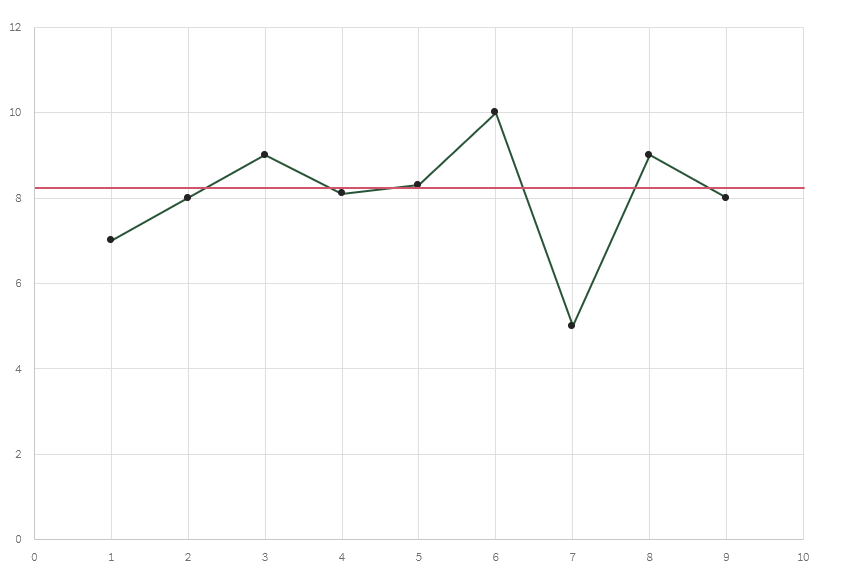
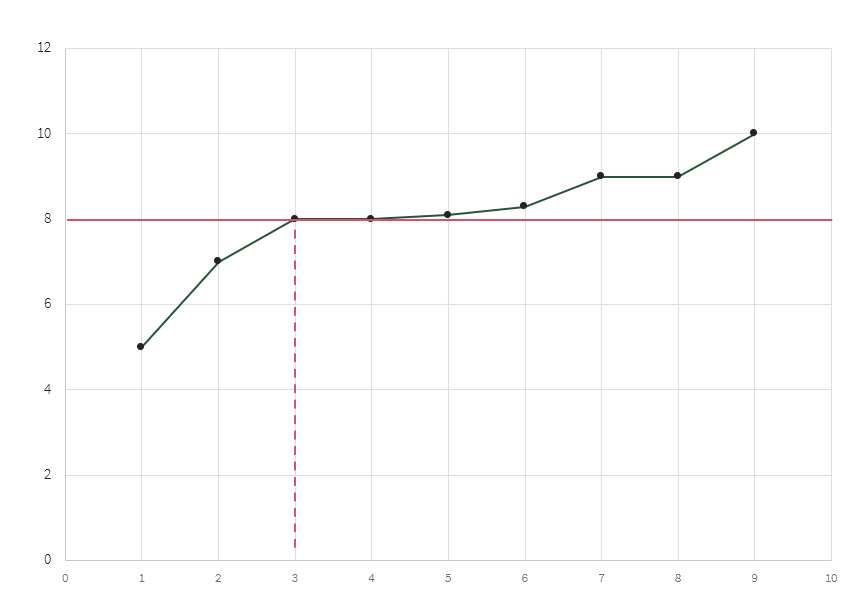
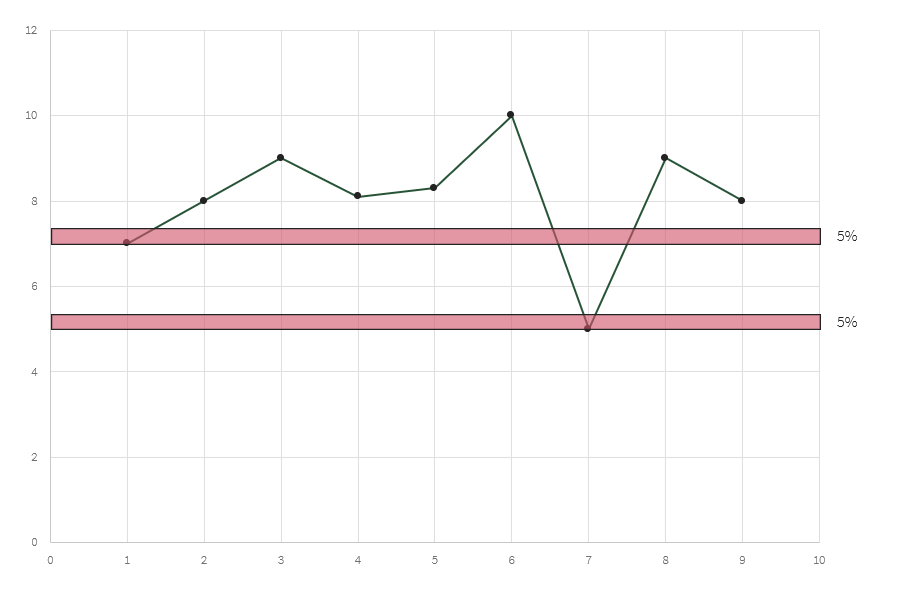
We are iterating over all samples, from the lowest to highest value. For each value, a ”bucket” is calculated that is 5% higher than that value. (If the time value is “5”, that bucket will be 5 x 1.05 = 5,25)
Now we’re looking at all values to see how many values fit into that bucket. (That is in the value range 5 to 5.25)
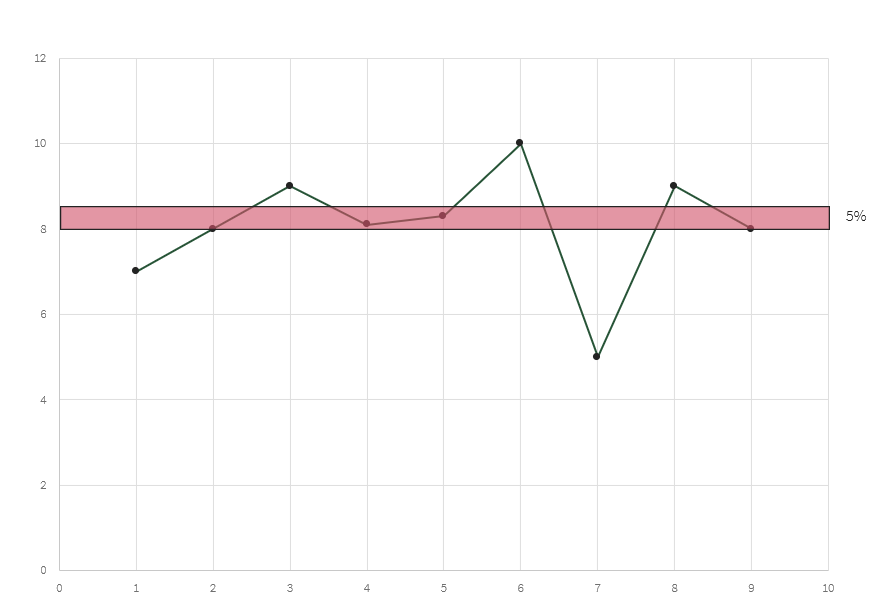
We are searching for a bucket with more than one value in it (because it should be repeatable).
When we find such a bucket, we calculate the average of all the values in that bucket.
In this case (8 + 8.1 + 8.3 + 8) /4 = 8.1
This is the estimated cycle time
Special cases
If the values are distributed in such a way that no repeatable value can be found. We are calculating the estimated cycle time as the 25% percentile for all the values.
If only one value is present. That value is used as the estimated cycle time